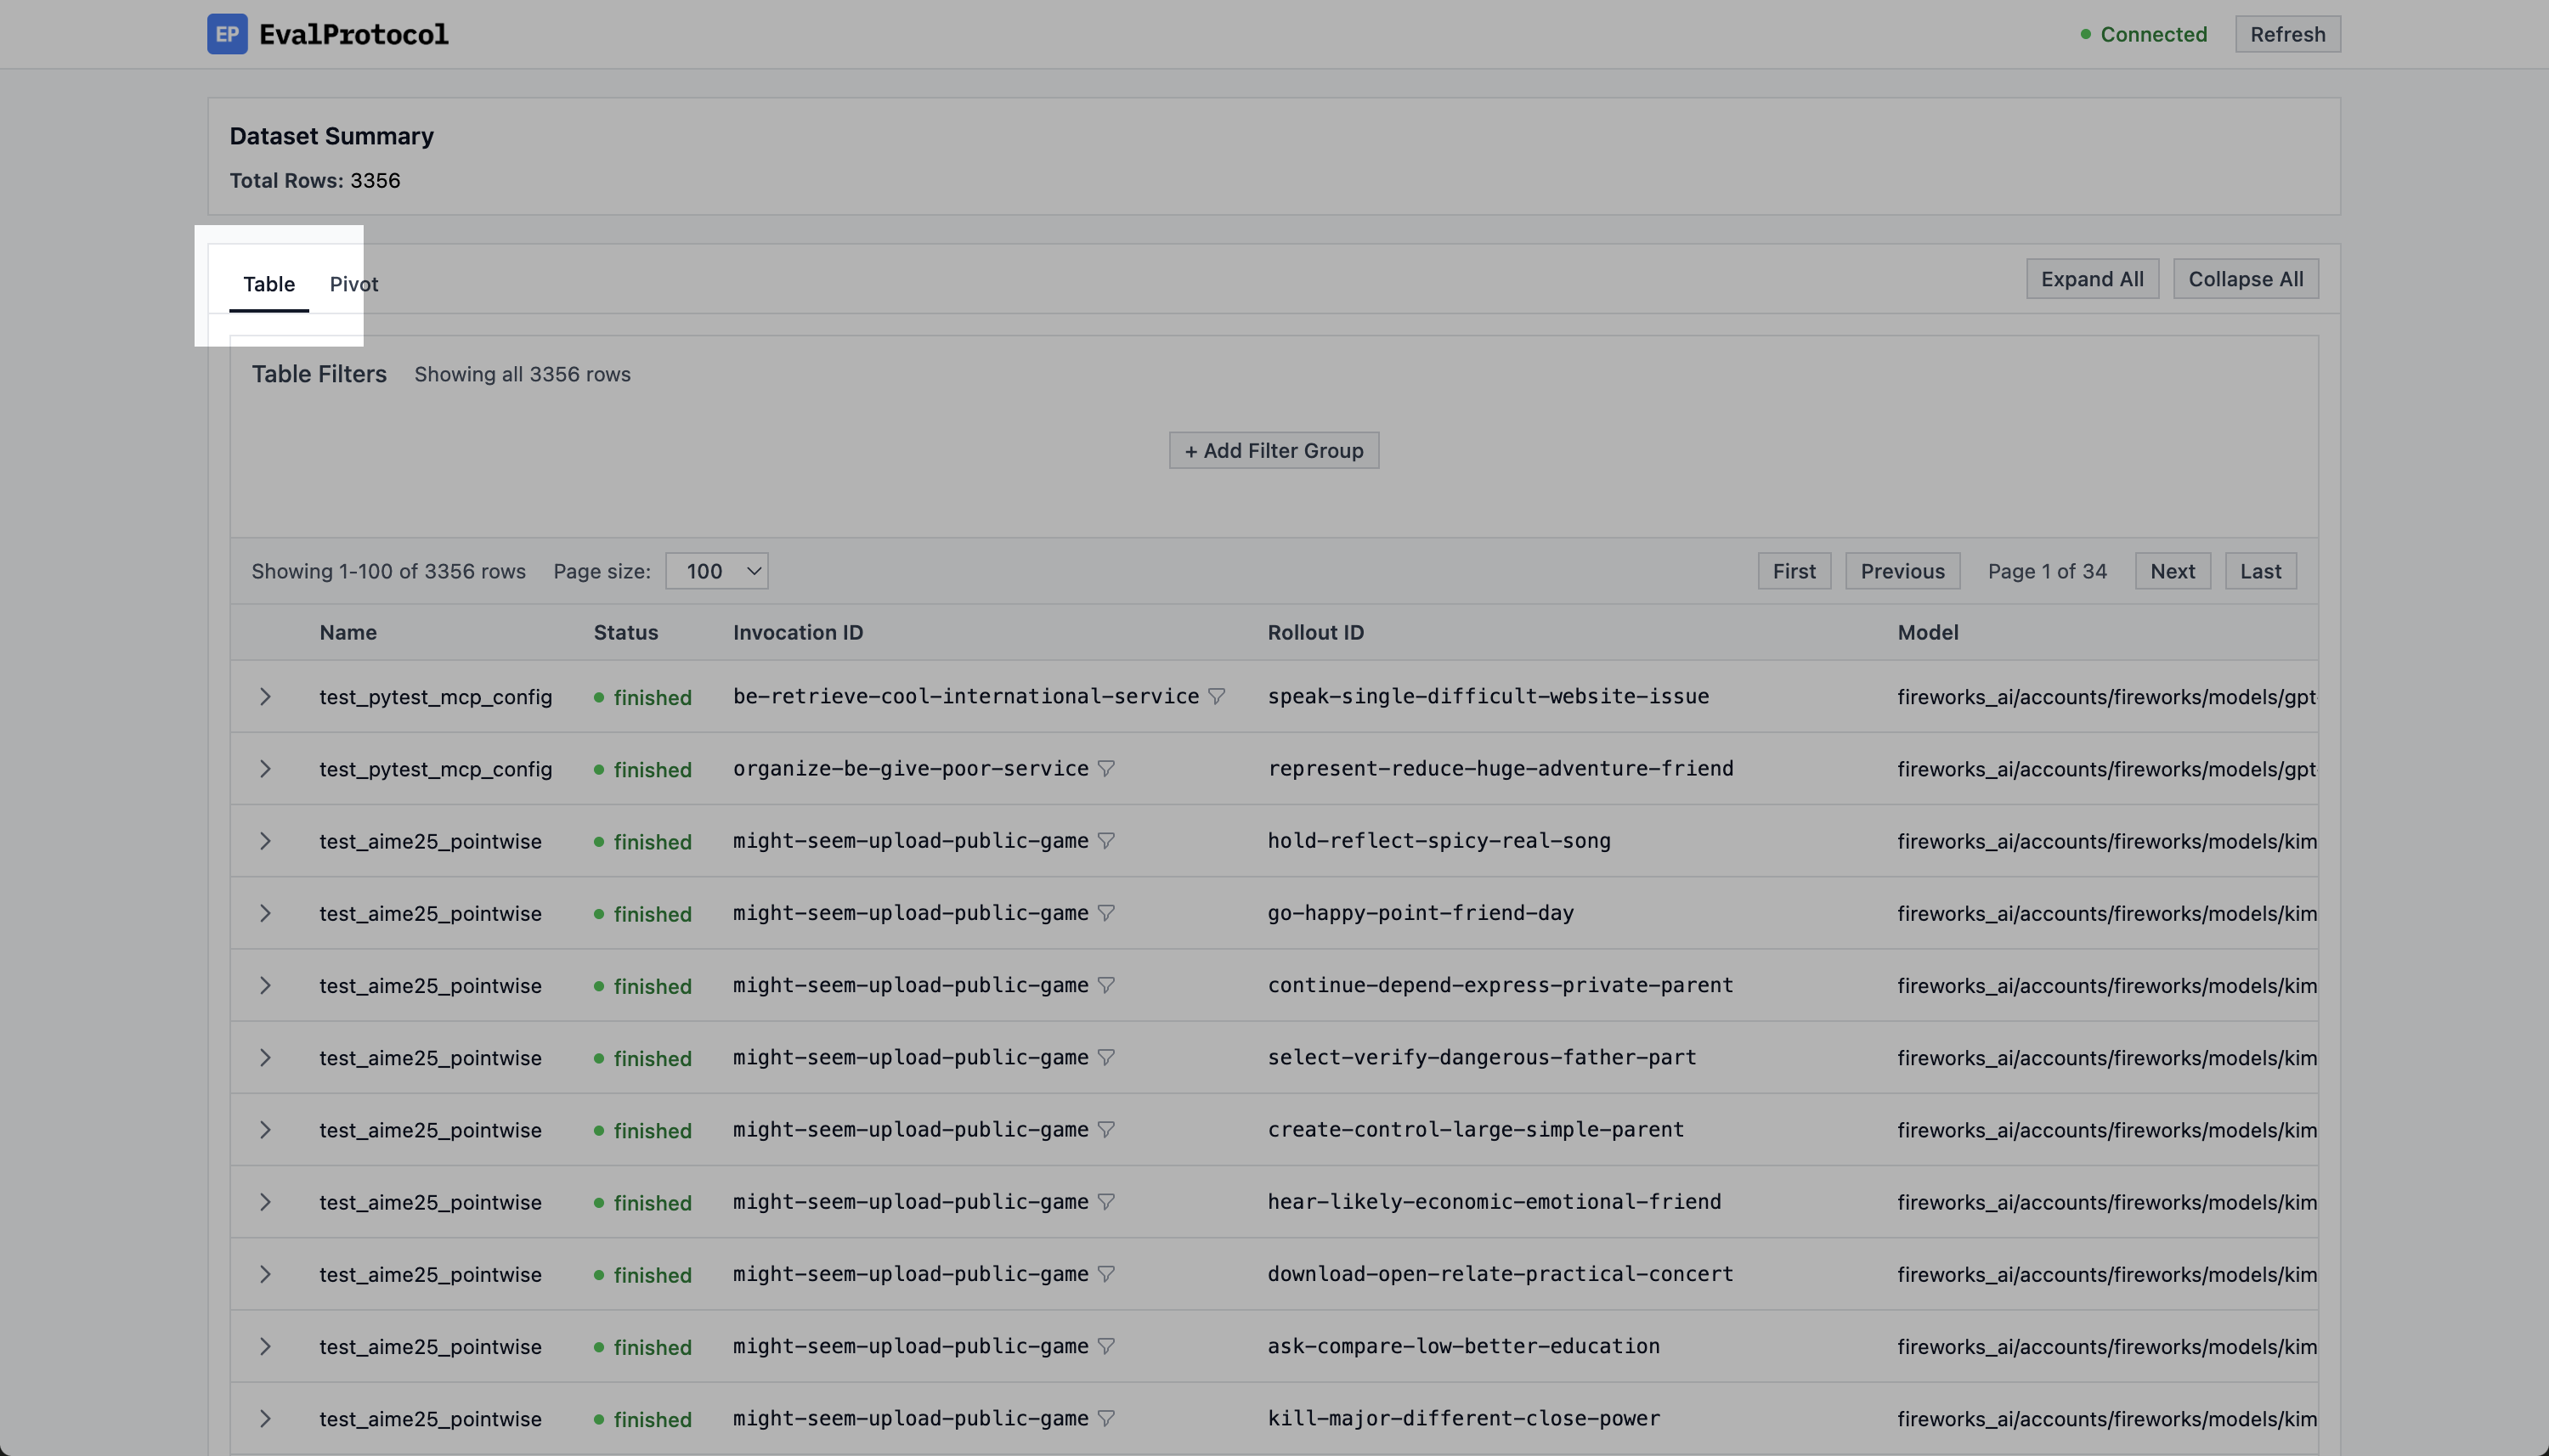
How to open the table view
To know if you are in the table view, check that theTable tab is selected in
the top left corner of the UI.
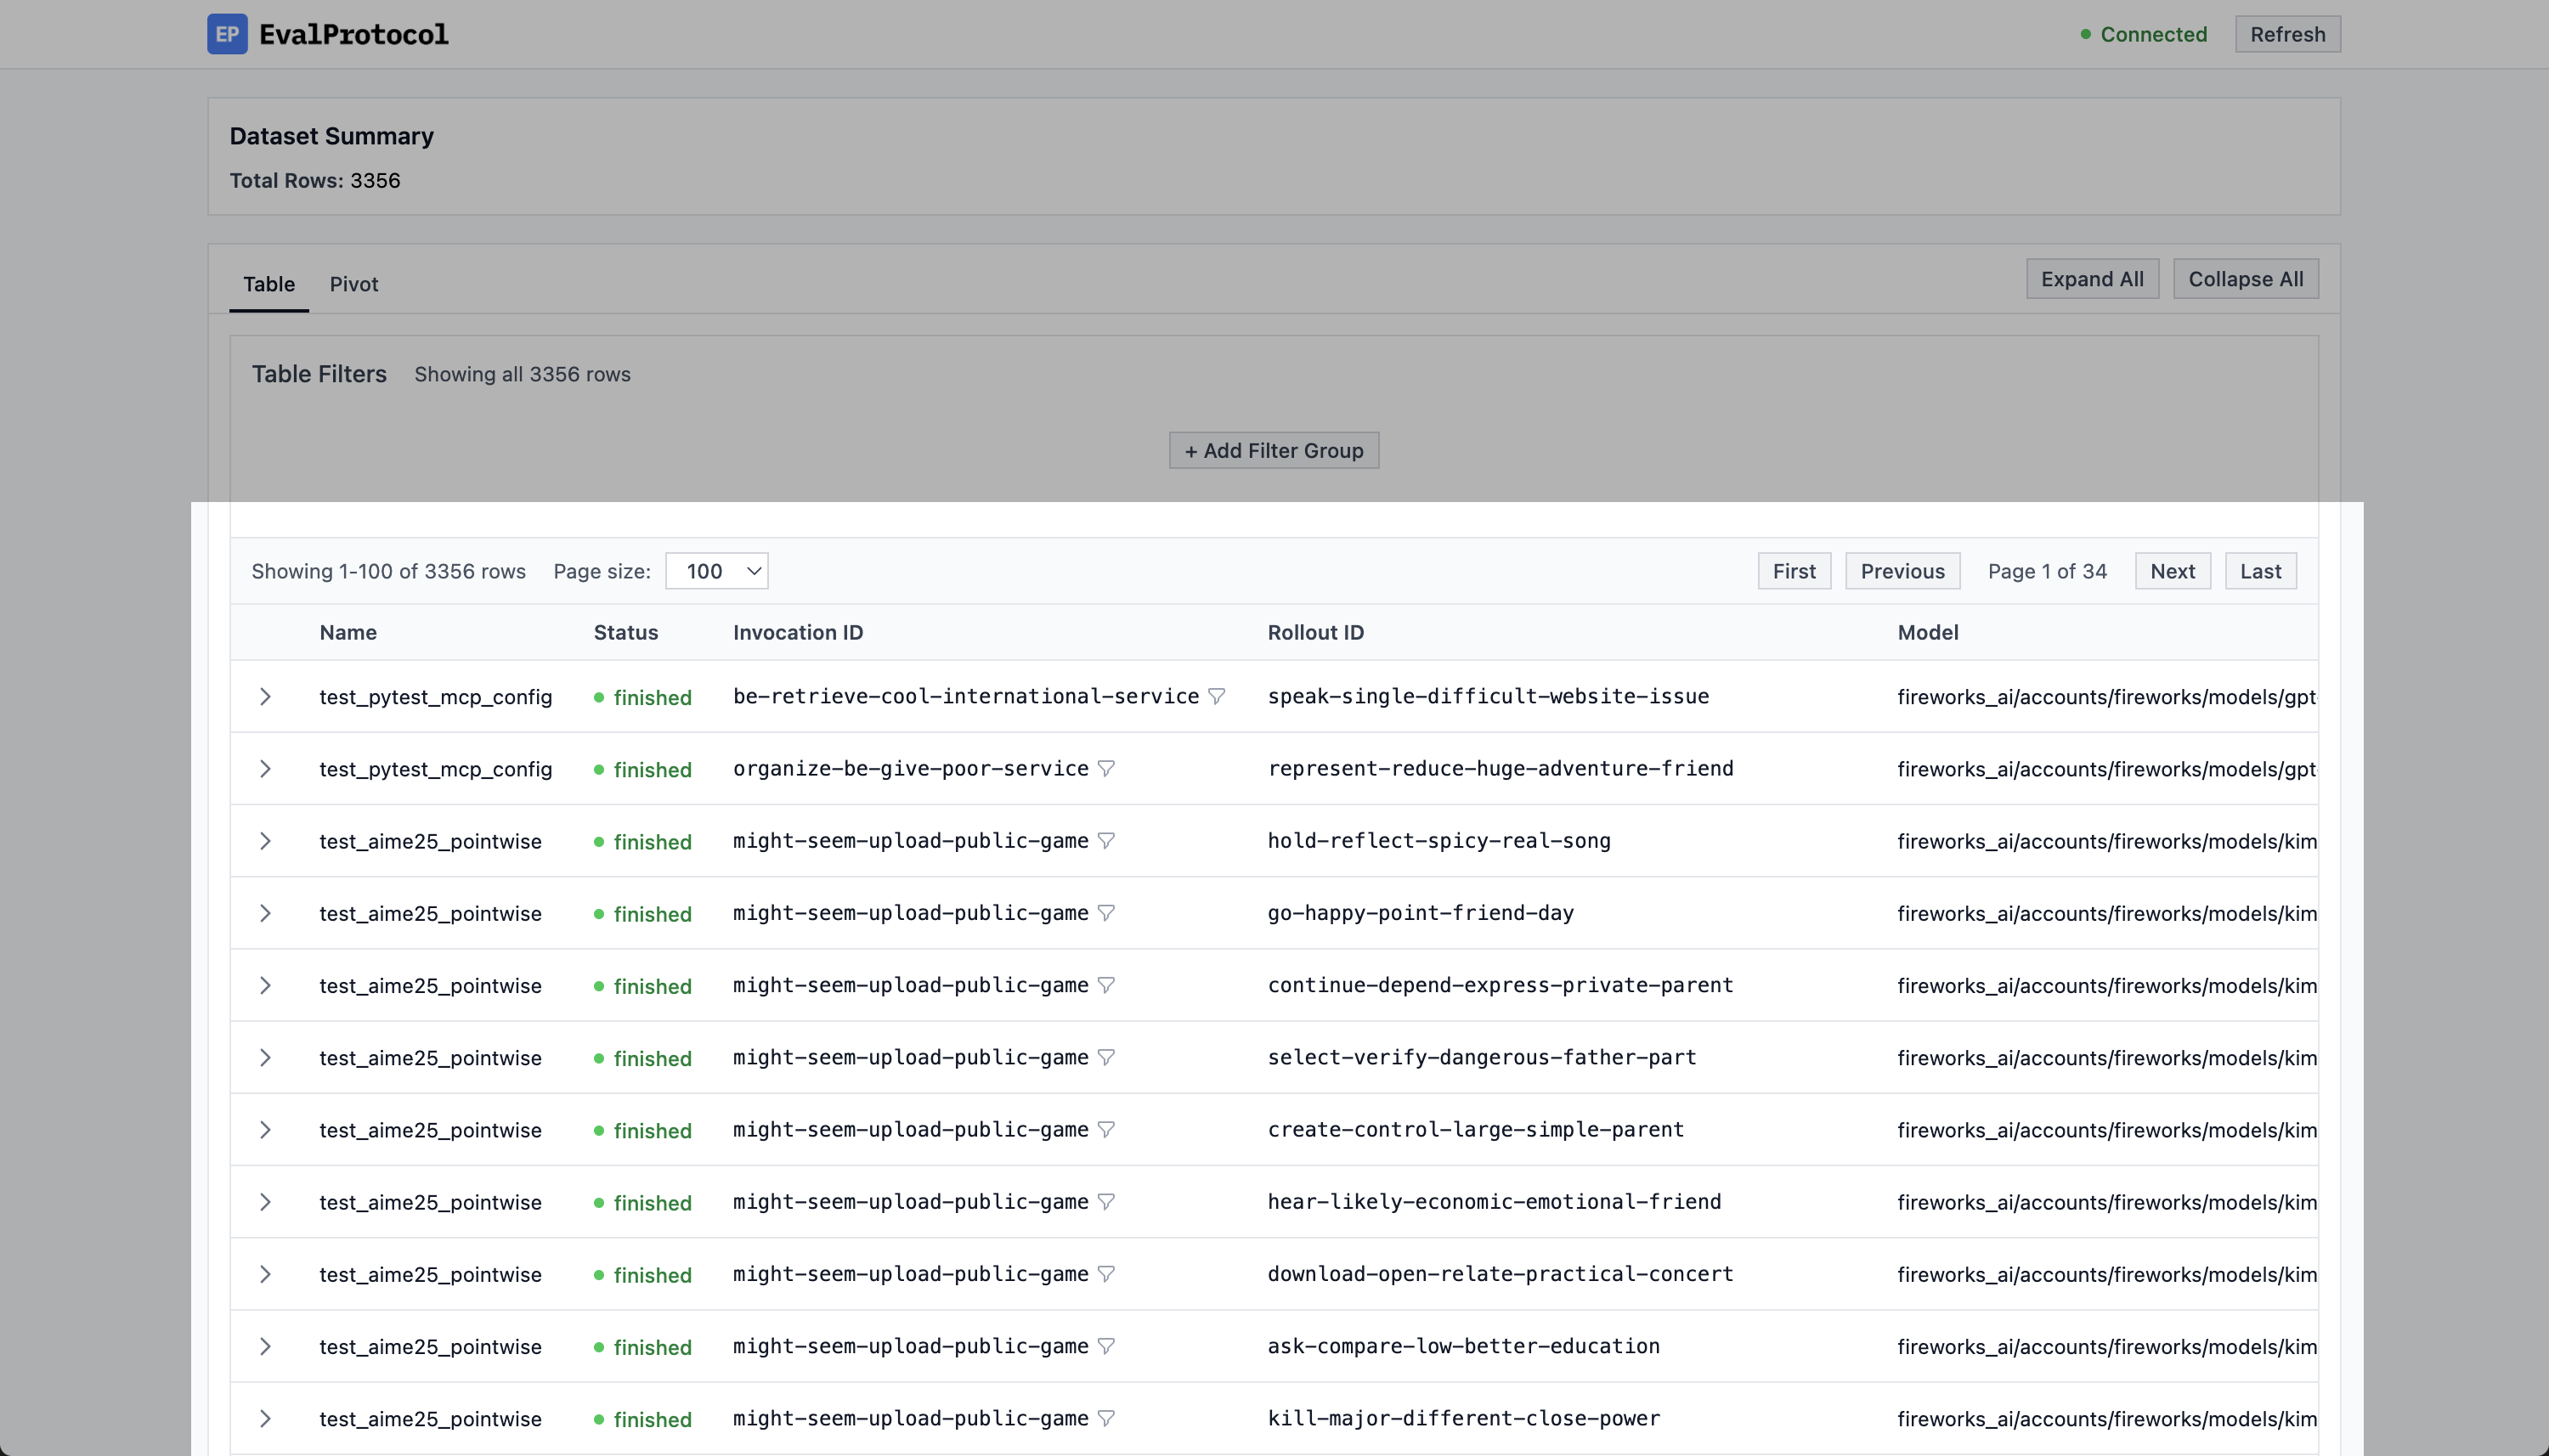
Inspecting a row
In the table view, you will see a list of evaluation rows. For each row, you can see:- Name: the test function name
- Status: either
running,finished,stopped, orerror - Invocation ID: auto-generated by EP for every invocation
- Rollout ID: auto-generated by EP for every rollout
- Model: the model used for the evaluation
- Score: found in
evaluation_result.score - Created: the timestamp of when the row was created
Chat Interface
On the left side of an expanded row, you can see the chat interface. This is where you can see the trajectory of the rollout to inspect the model’s responses and tool calls.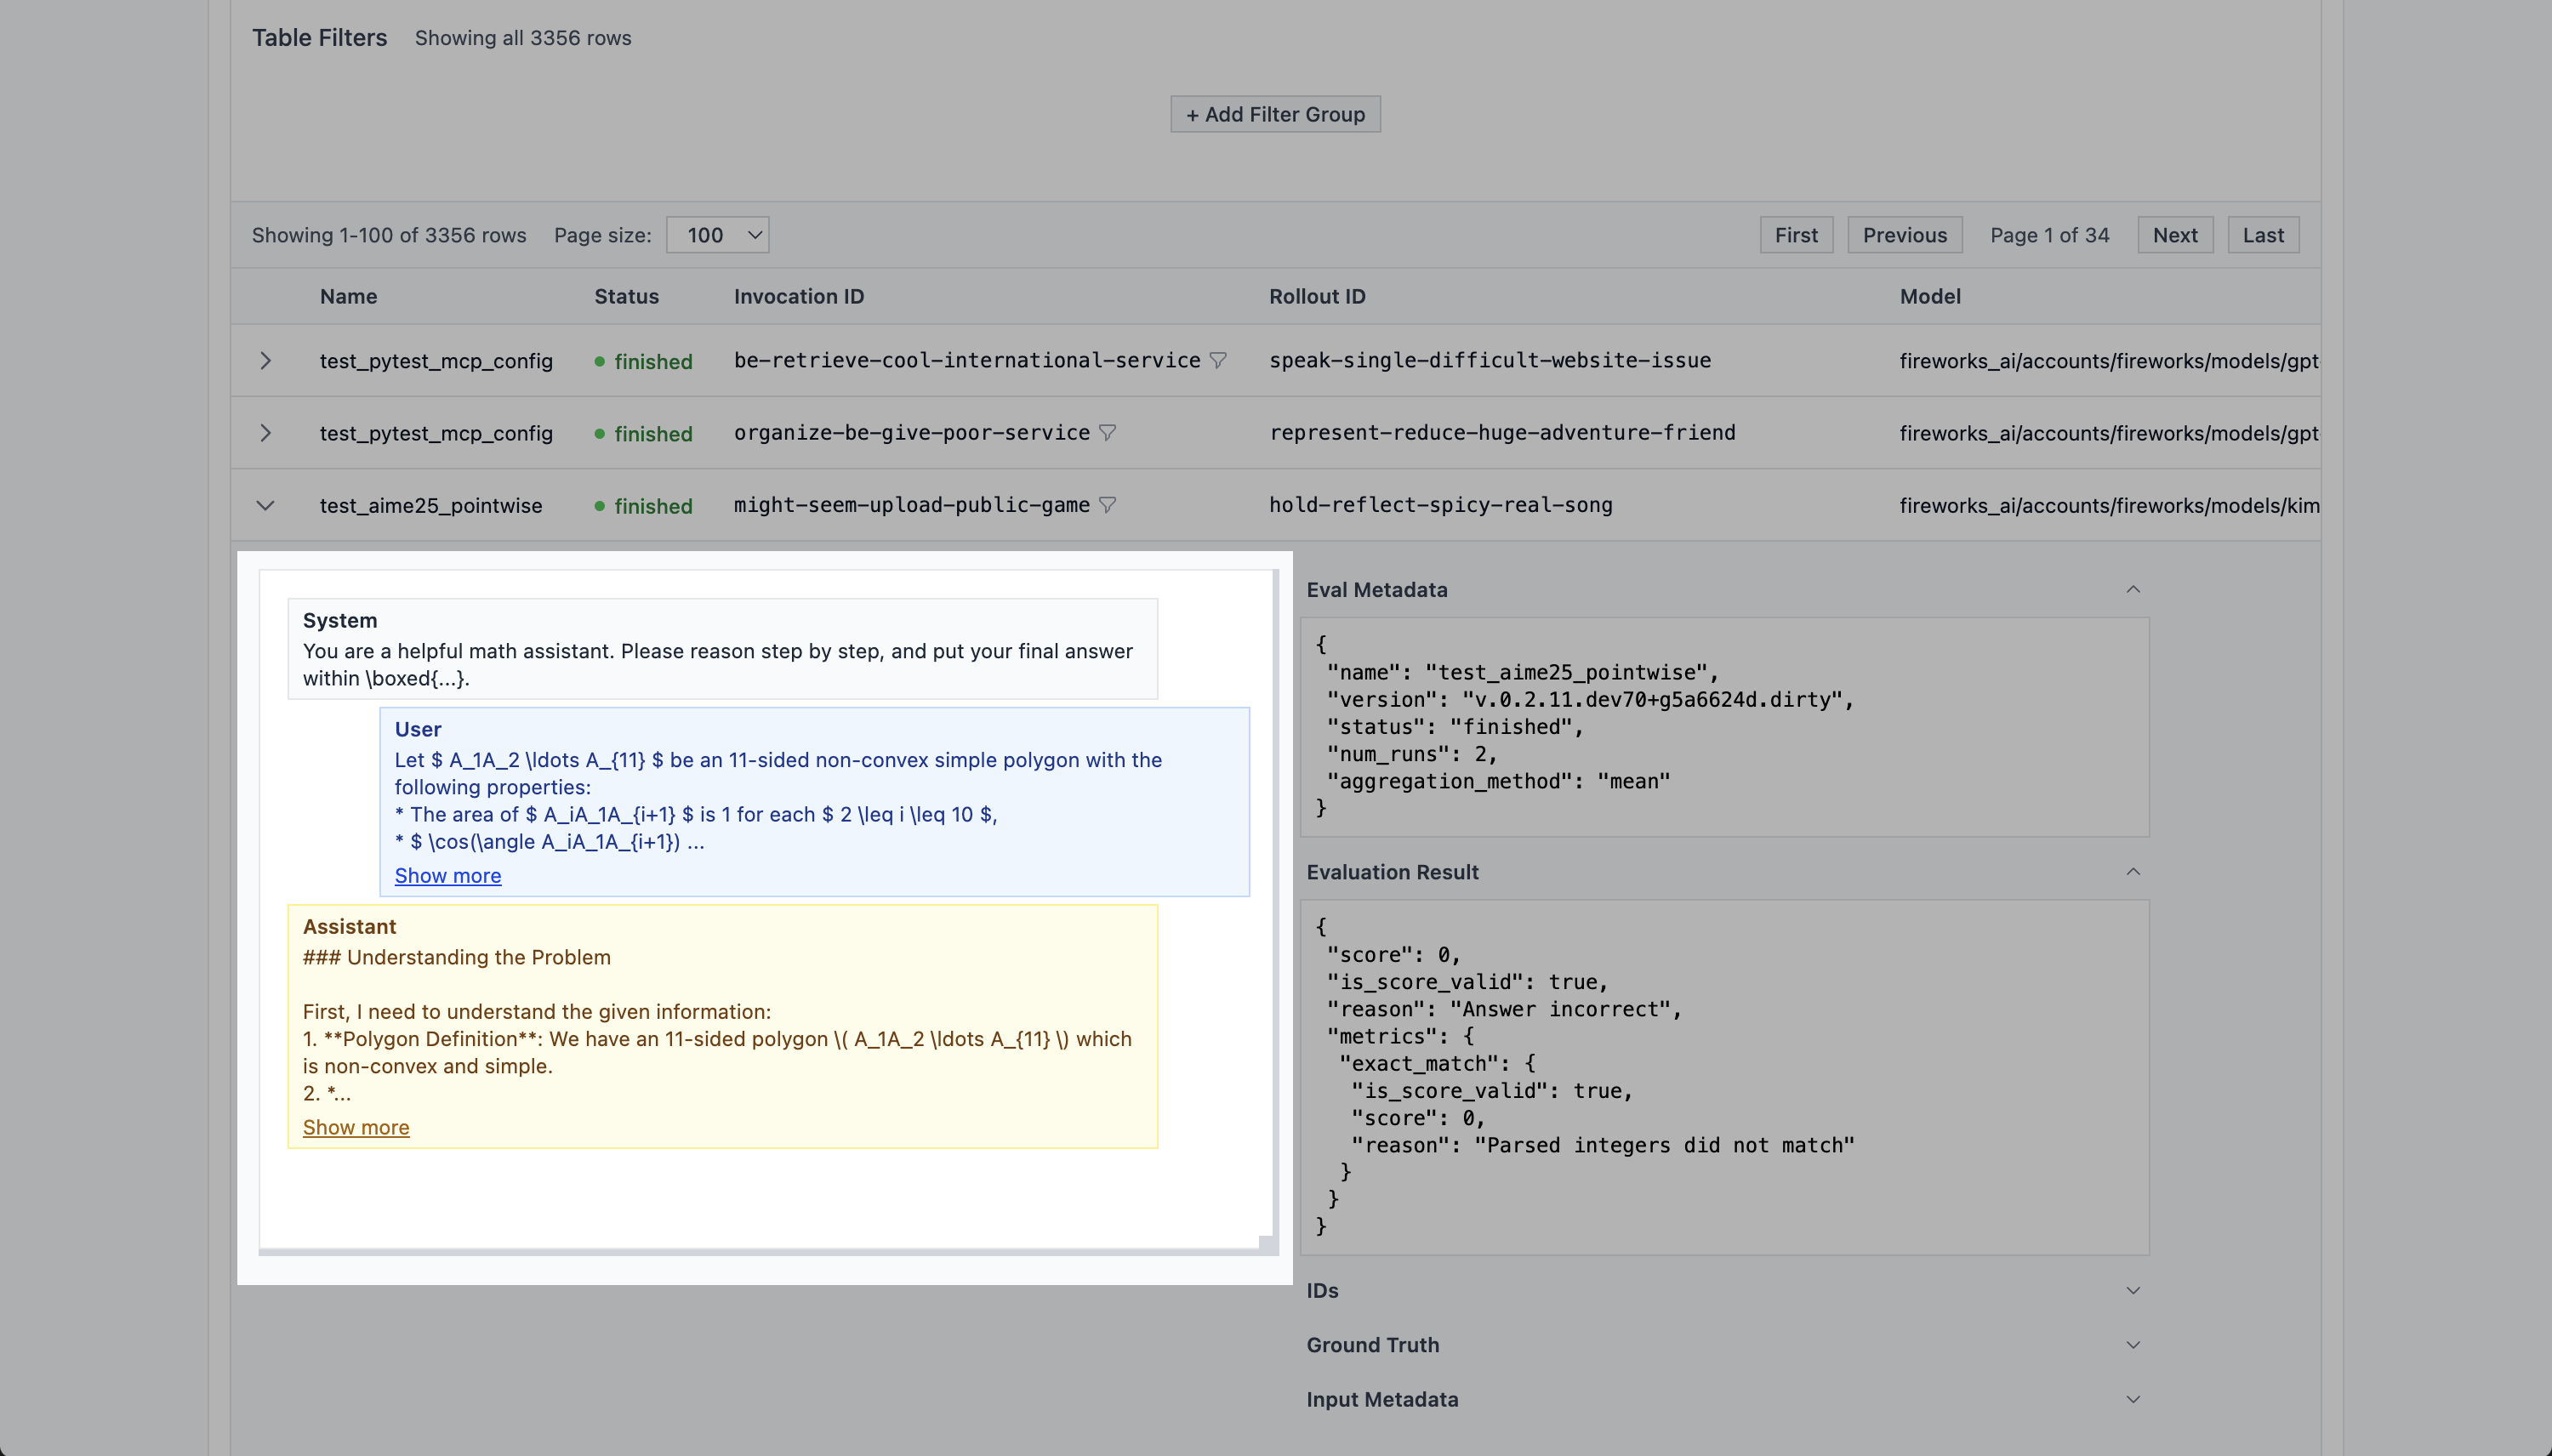
Metadata
On the right side of an expanded row, you can see the metadata. This is where you can see the evaluation results, IDs, input metadata, and eval metadata.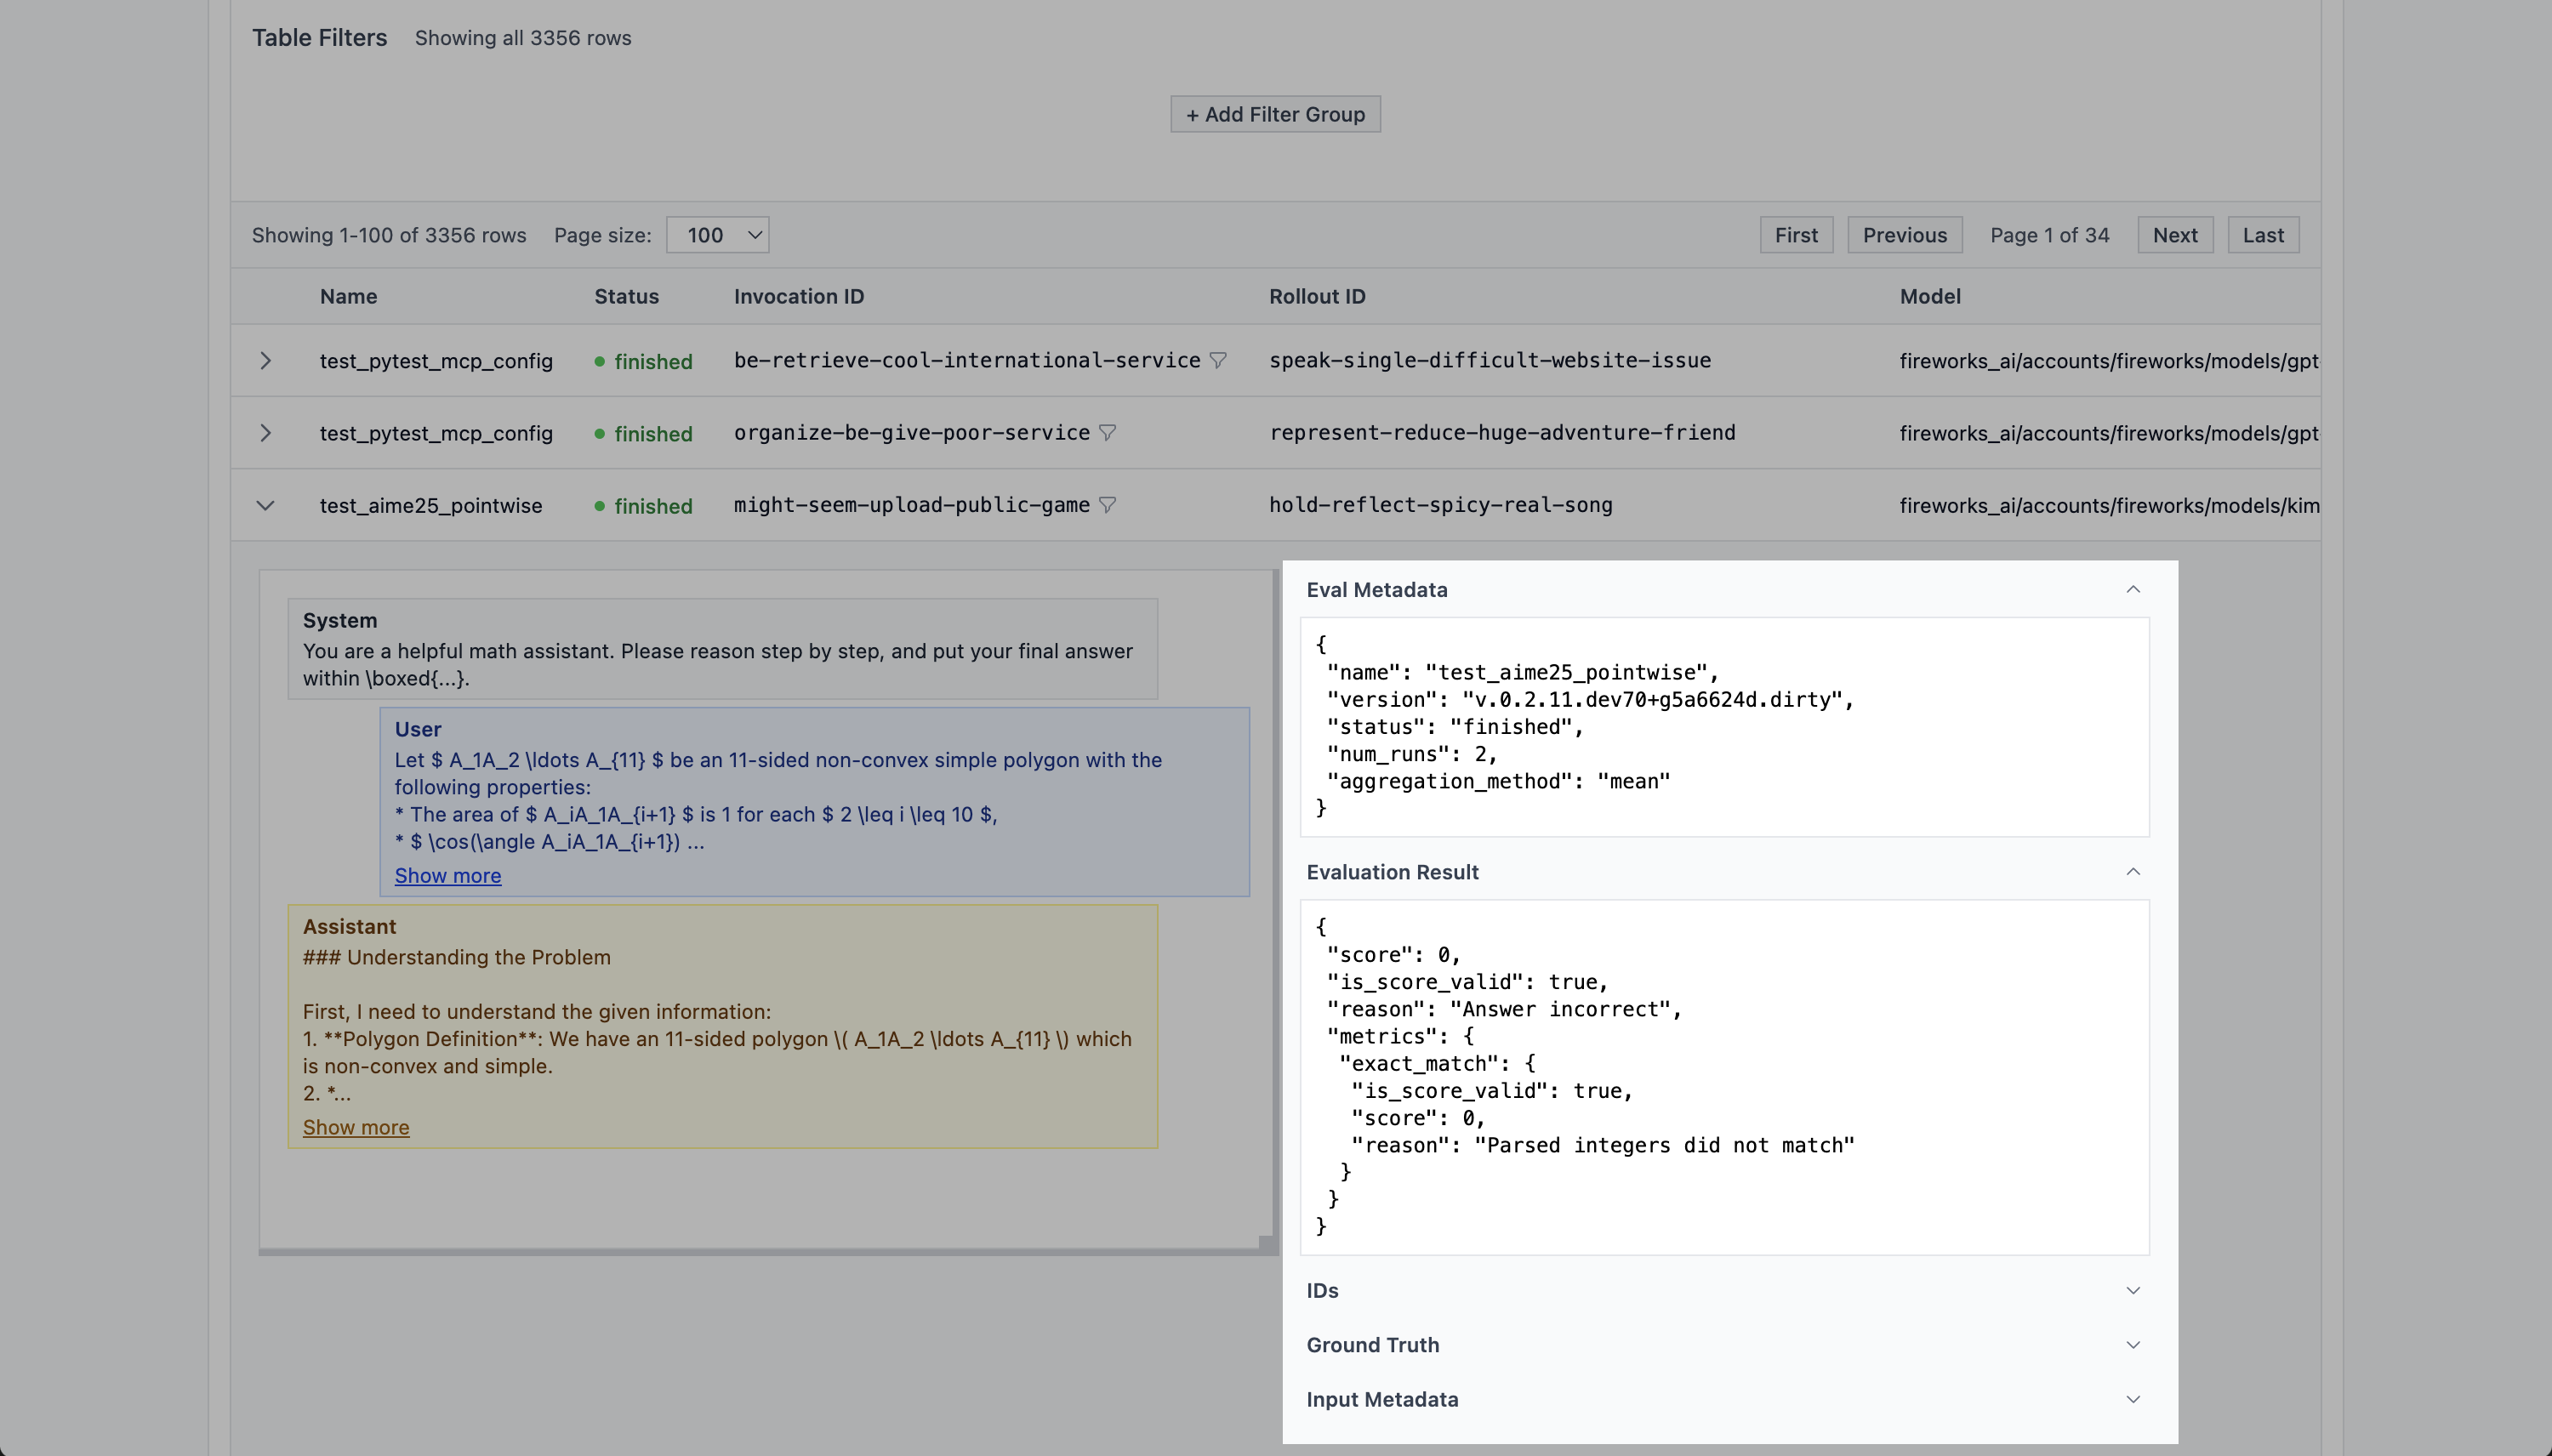
Filtering
Above the table, you can see a section for configuring filters. You can filter based on any attribute of the evaluation row.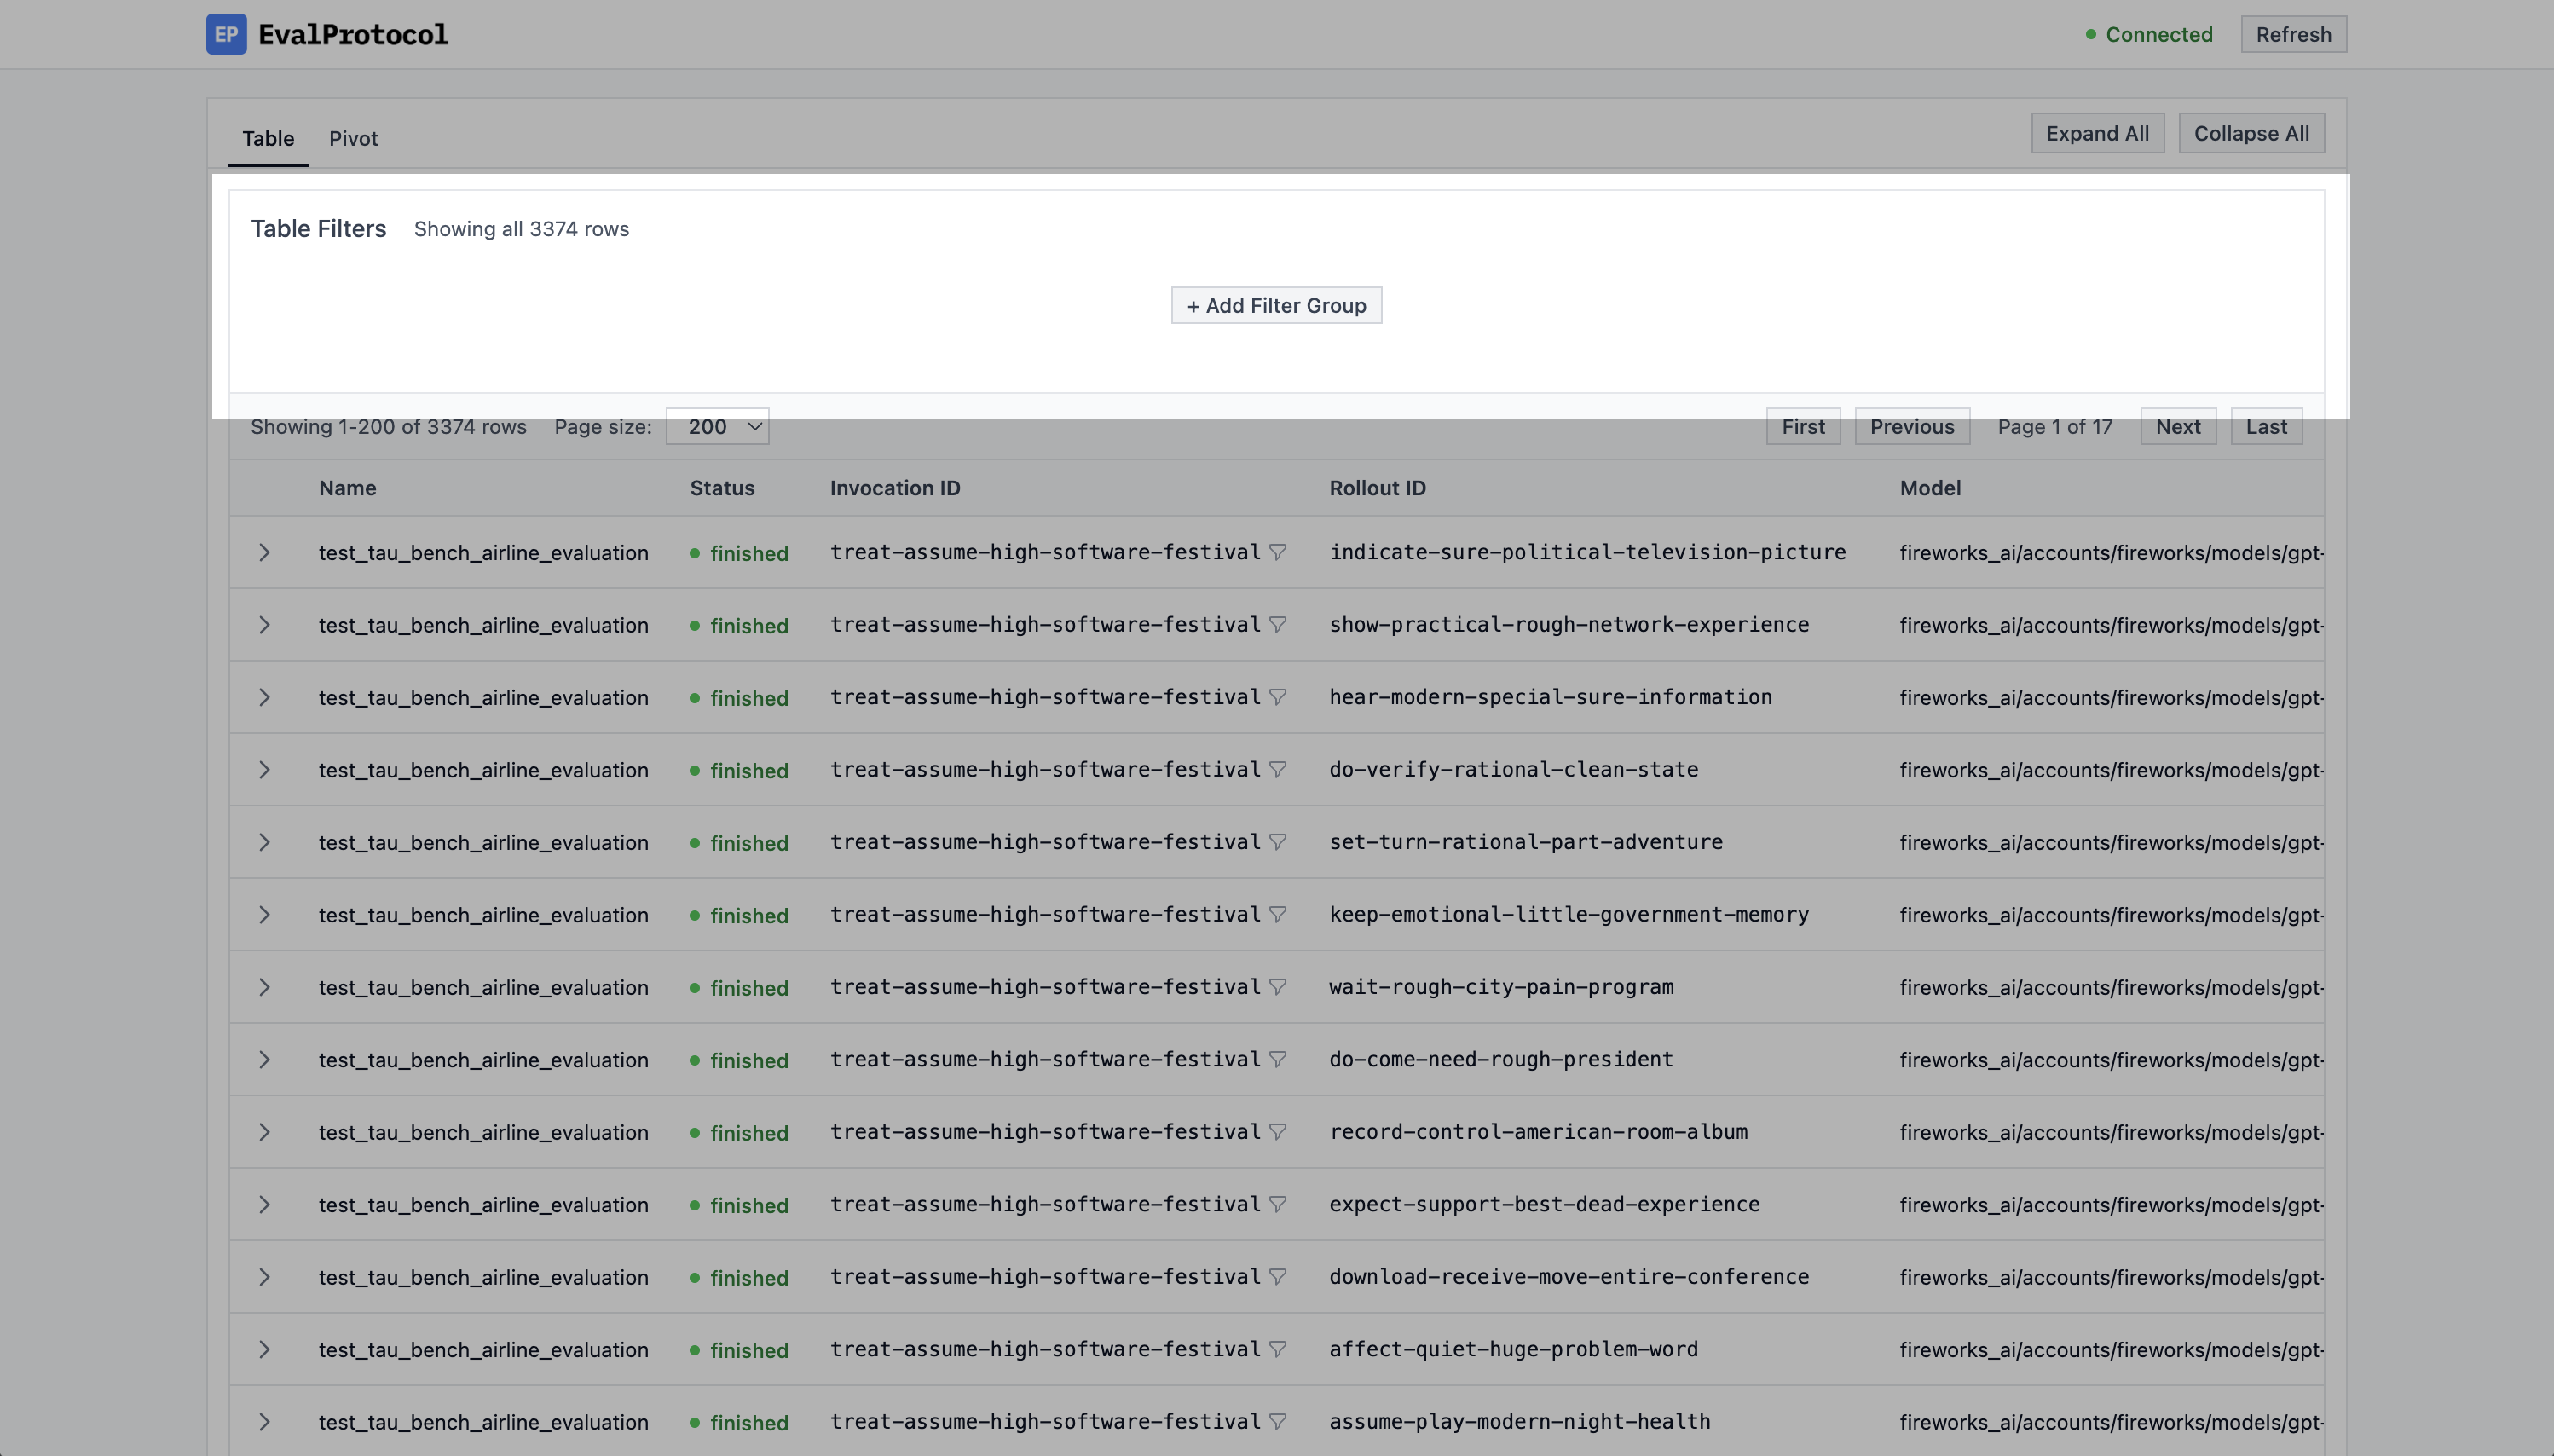
Filtering based on Invocation ID
Often times you just want to see the rollouts for a single invocation. To do this, you can easily click on the funnel icon next to the invocation ID in the table. This will automatically add a filter for the invocation ID to the table.Custom filters
You can also create custom filters by clicking on the+ Add Filter Group
button above the table. Then you can choose to filter by AND or OR and add
filters to the group by clicking on the + Add Filter to Group button.
Viewing live rollouts
When it takes a long time to run an eval, it can be helpful to see the live rollouts so you can track the progress of an eval and catch unexpected errors or problems. Whenever you run an@evaluation_test, the UI automatically shows running
tests and you can watch rollouts live in the chat interface. When a test finishes,
detailed evaluation results appear to the right of the chat.
Checkout this example of a test running in VSCode and the UI updating with the
rollout.