> ## Documentation Index
> Fetch the complete documentation index at: https://evalprotocol.io/llms.txt
> Use this file to discover all available pages before exploring further.
# Pivot View
EP's convenient and locally hosted UI offers a pivot view to help you analyze
your data. If you a familiar with Excel's Pivot Tables, you will feel right at
home. For those who are unfamiliar, pivot tables are an easy way to summarize
and analyze data without having to write formulas or code.
Using a pivot table, you can easily compute aggregate metrics across your data to answer questions like:
* Which model performs best for my application?
* Which prompt performs best for my application?
* How does each model perform on this evaluation and dataset?
* What impact does temperature have on model performance?
* Which tasks in my dataset are the most challenging?
* Is my fine-tuned model outperforming the base model?
* What is the average score across multiple runs?
* Which set of completion parameters yields the best results?
### How to open the pivot view
To know if you are in the pivot view, check that the `Pivot` tab is selected in
the top left corner of the UI.
Make sure you are in the Pivot View by checking the top left corner of the UI for the Pivot tab.}>
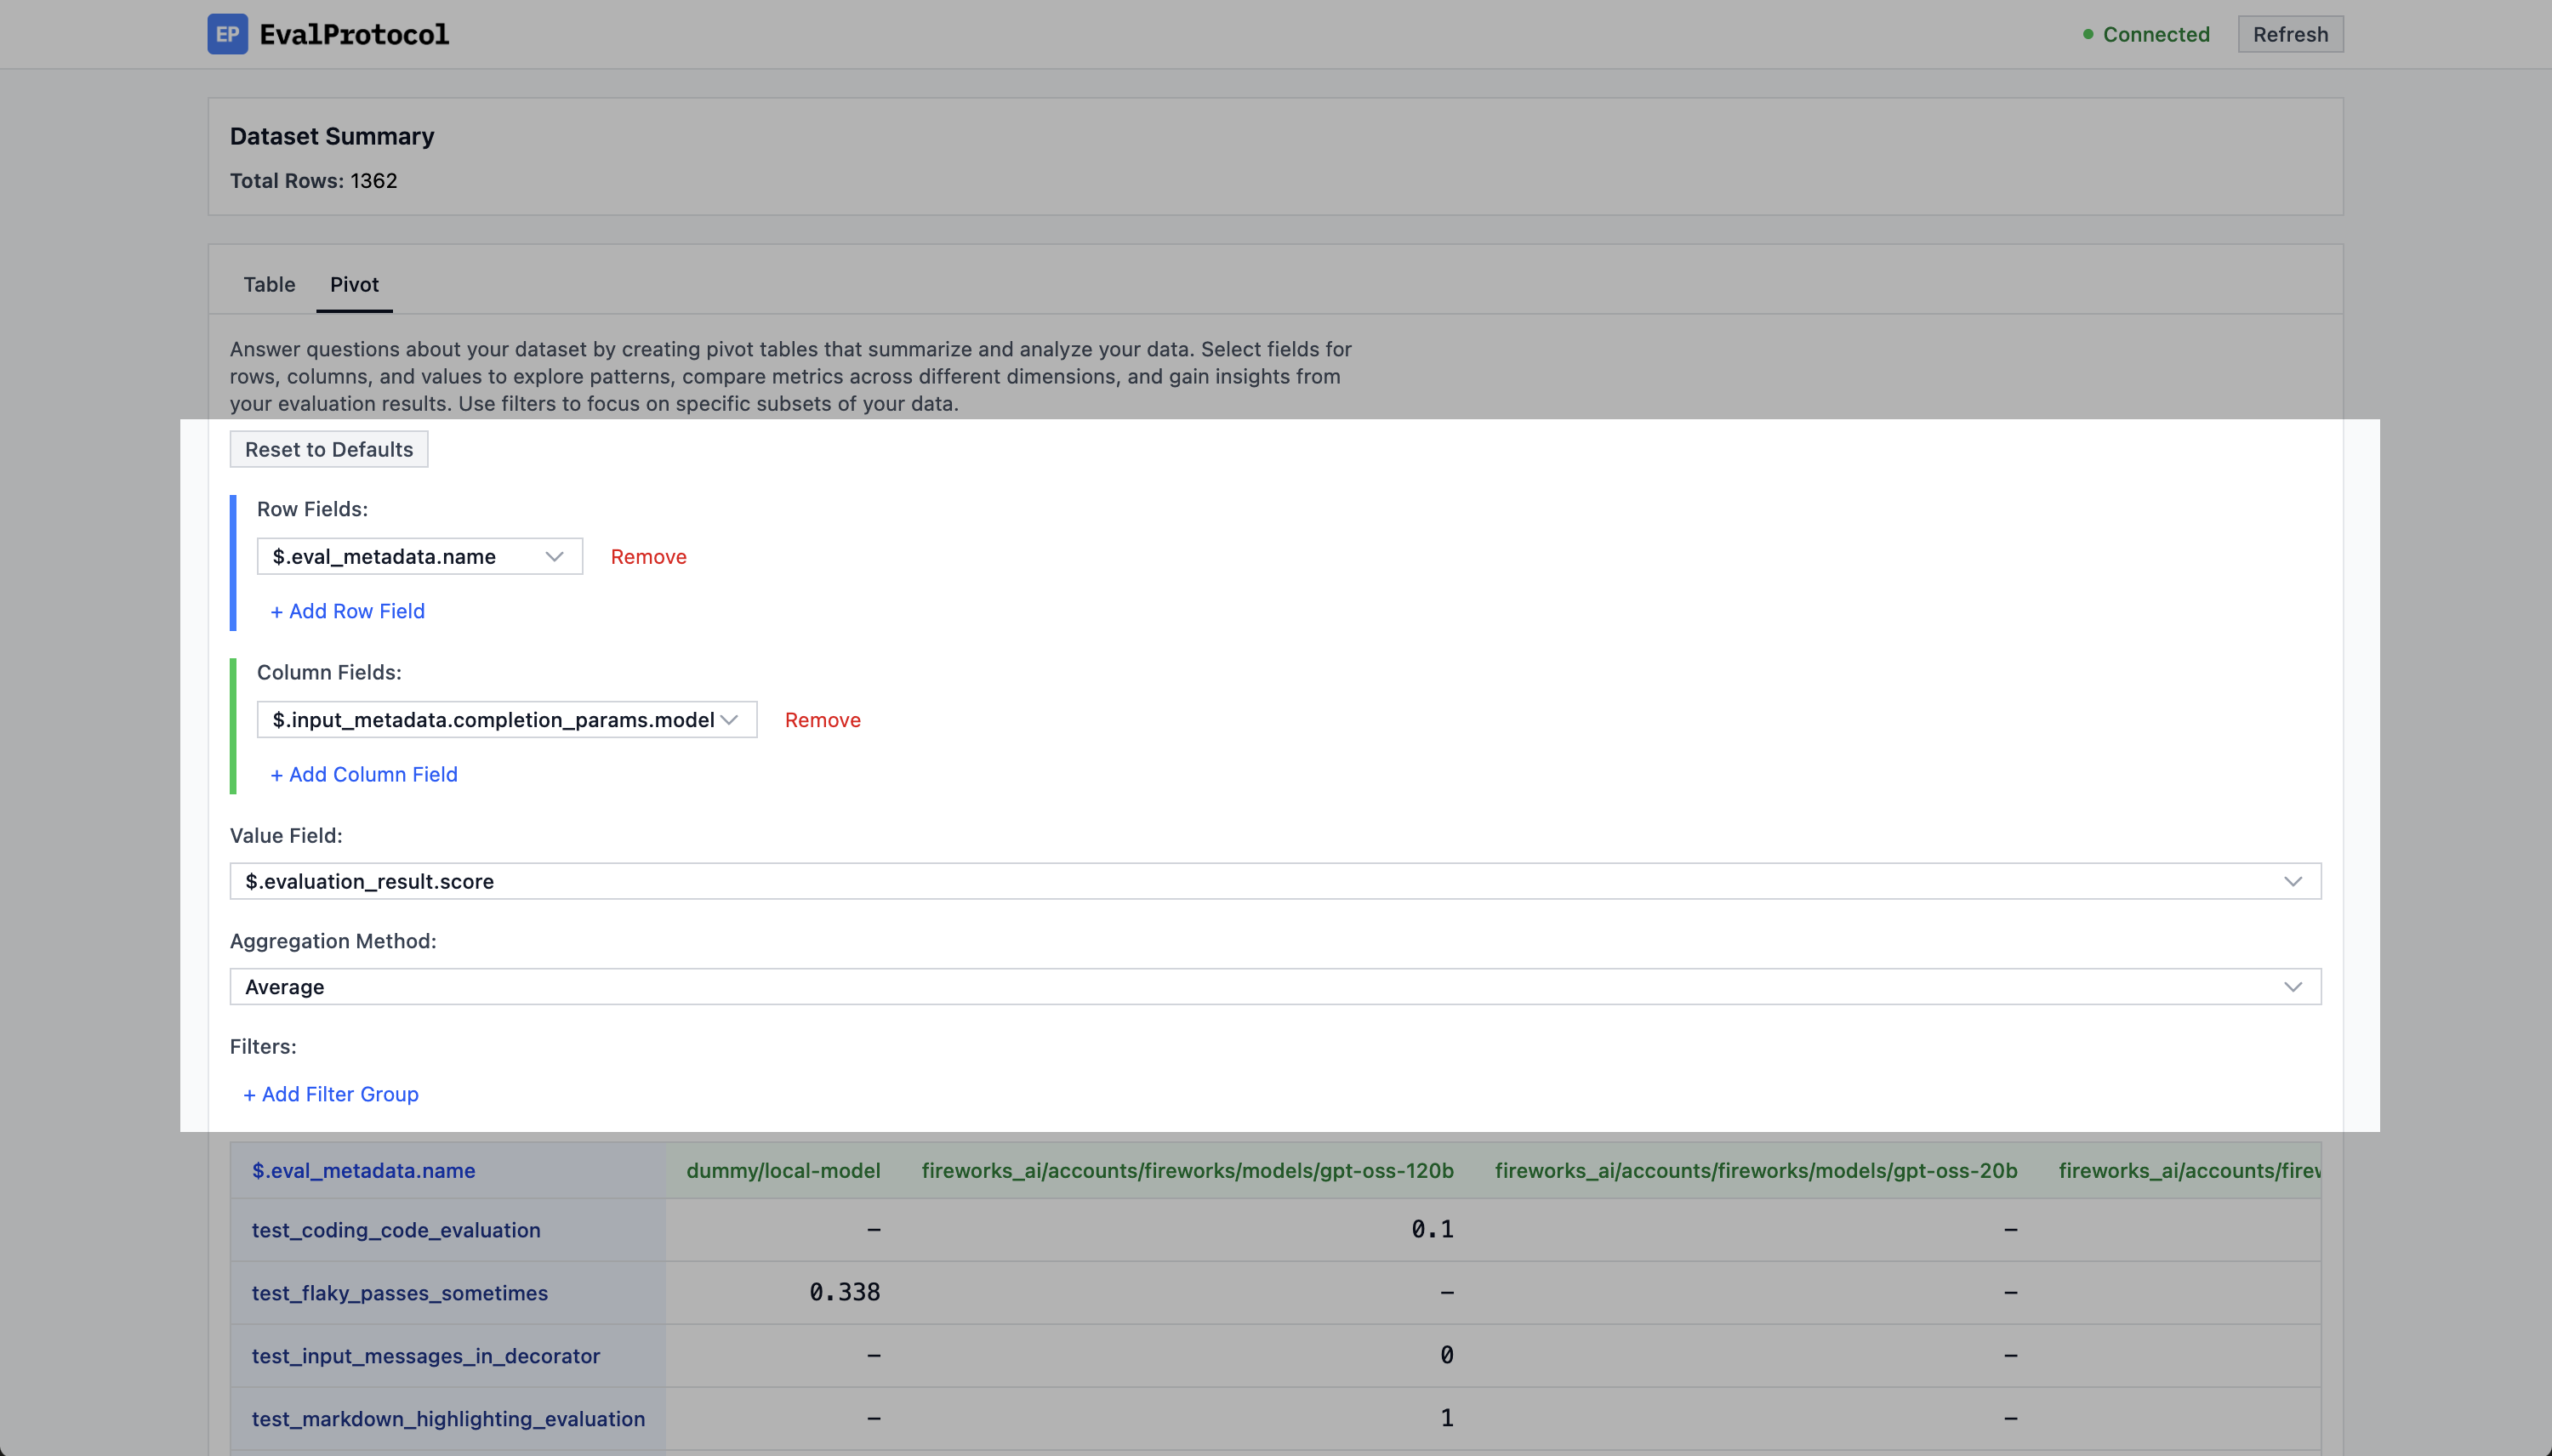
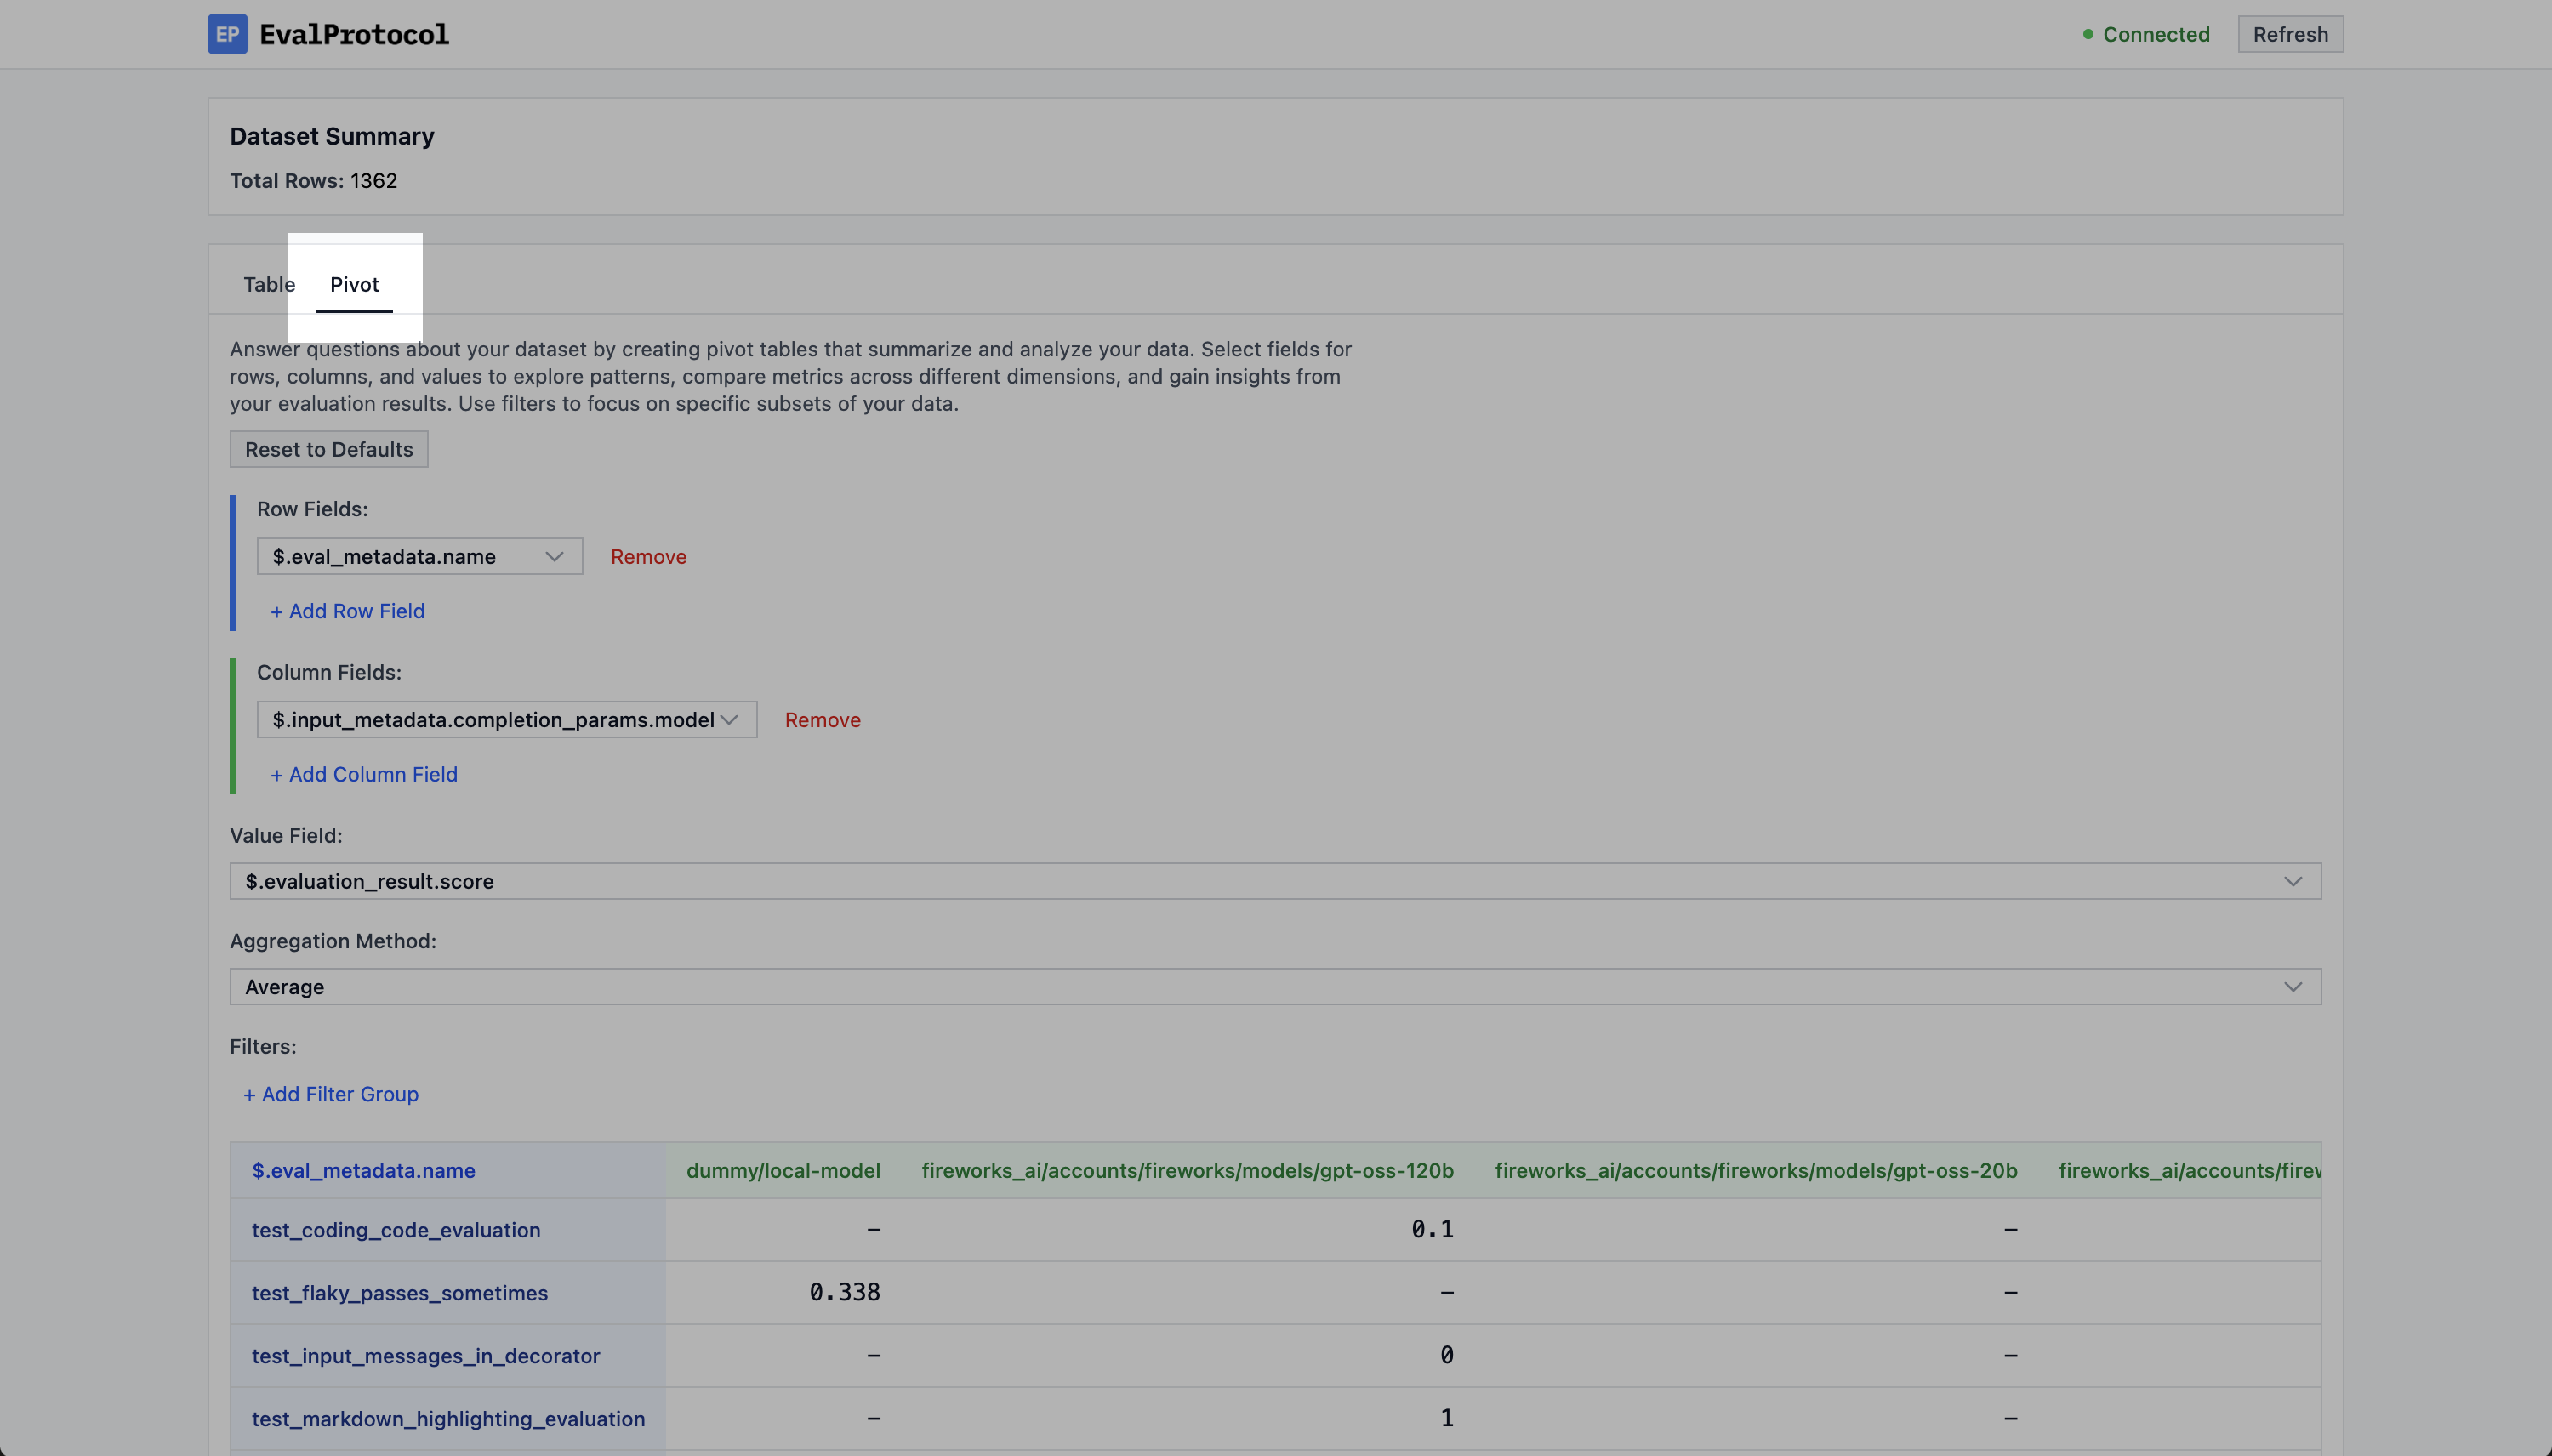 ### Configuring the pivot table
In the pivot view, you will see a section at the top where you configure your
pivot table.
The pivot table configuration section.}>
### Configuring the pivot table
In the pivot view, you will see a section at the top where you configure your
pivot table.
The pivot table configuration section.}>
 The pivot table configuration section has five parts:
* **Pivot Rows**: The rows that will be used to group the data.
* **Pivot Columns**: The columns that will be used to group the data.
* **Pivot Values**: The values that will be used to aggregate the data.
* **Pivot Aggregation**: The aggregation function to use for the values.
* **Pivot Filters**: The filters that will be used to filter the data.
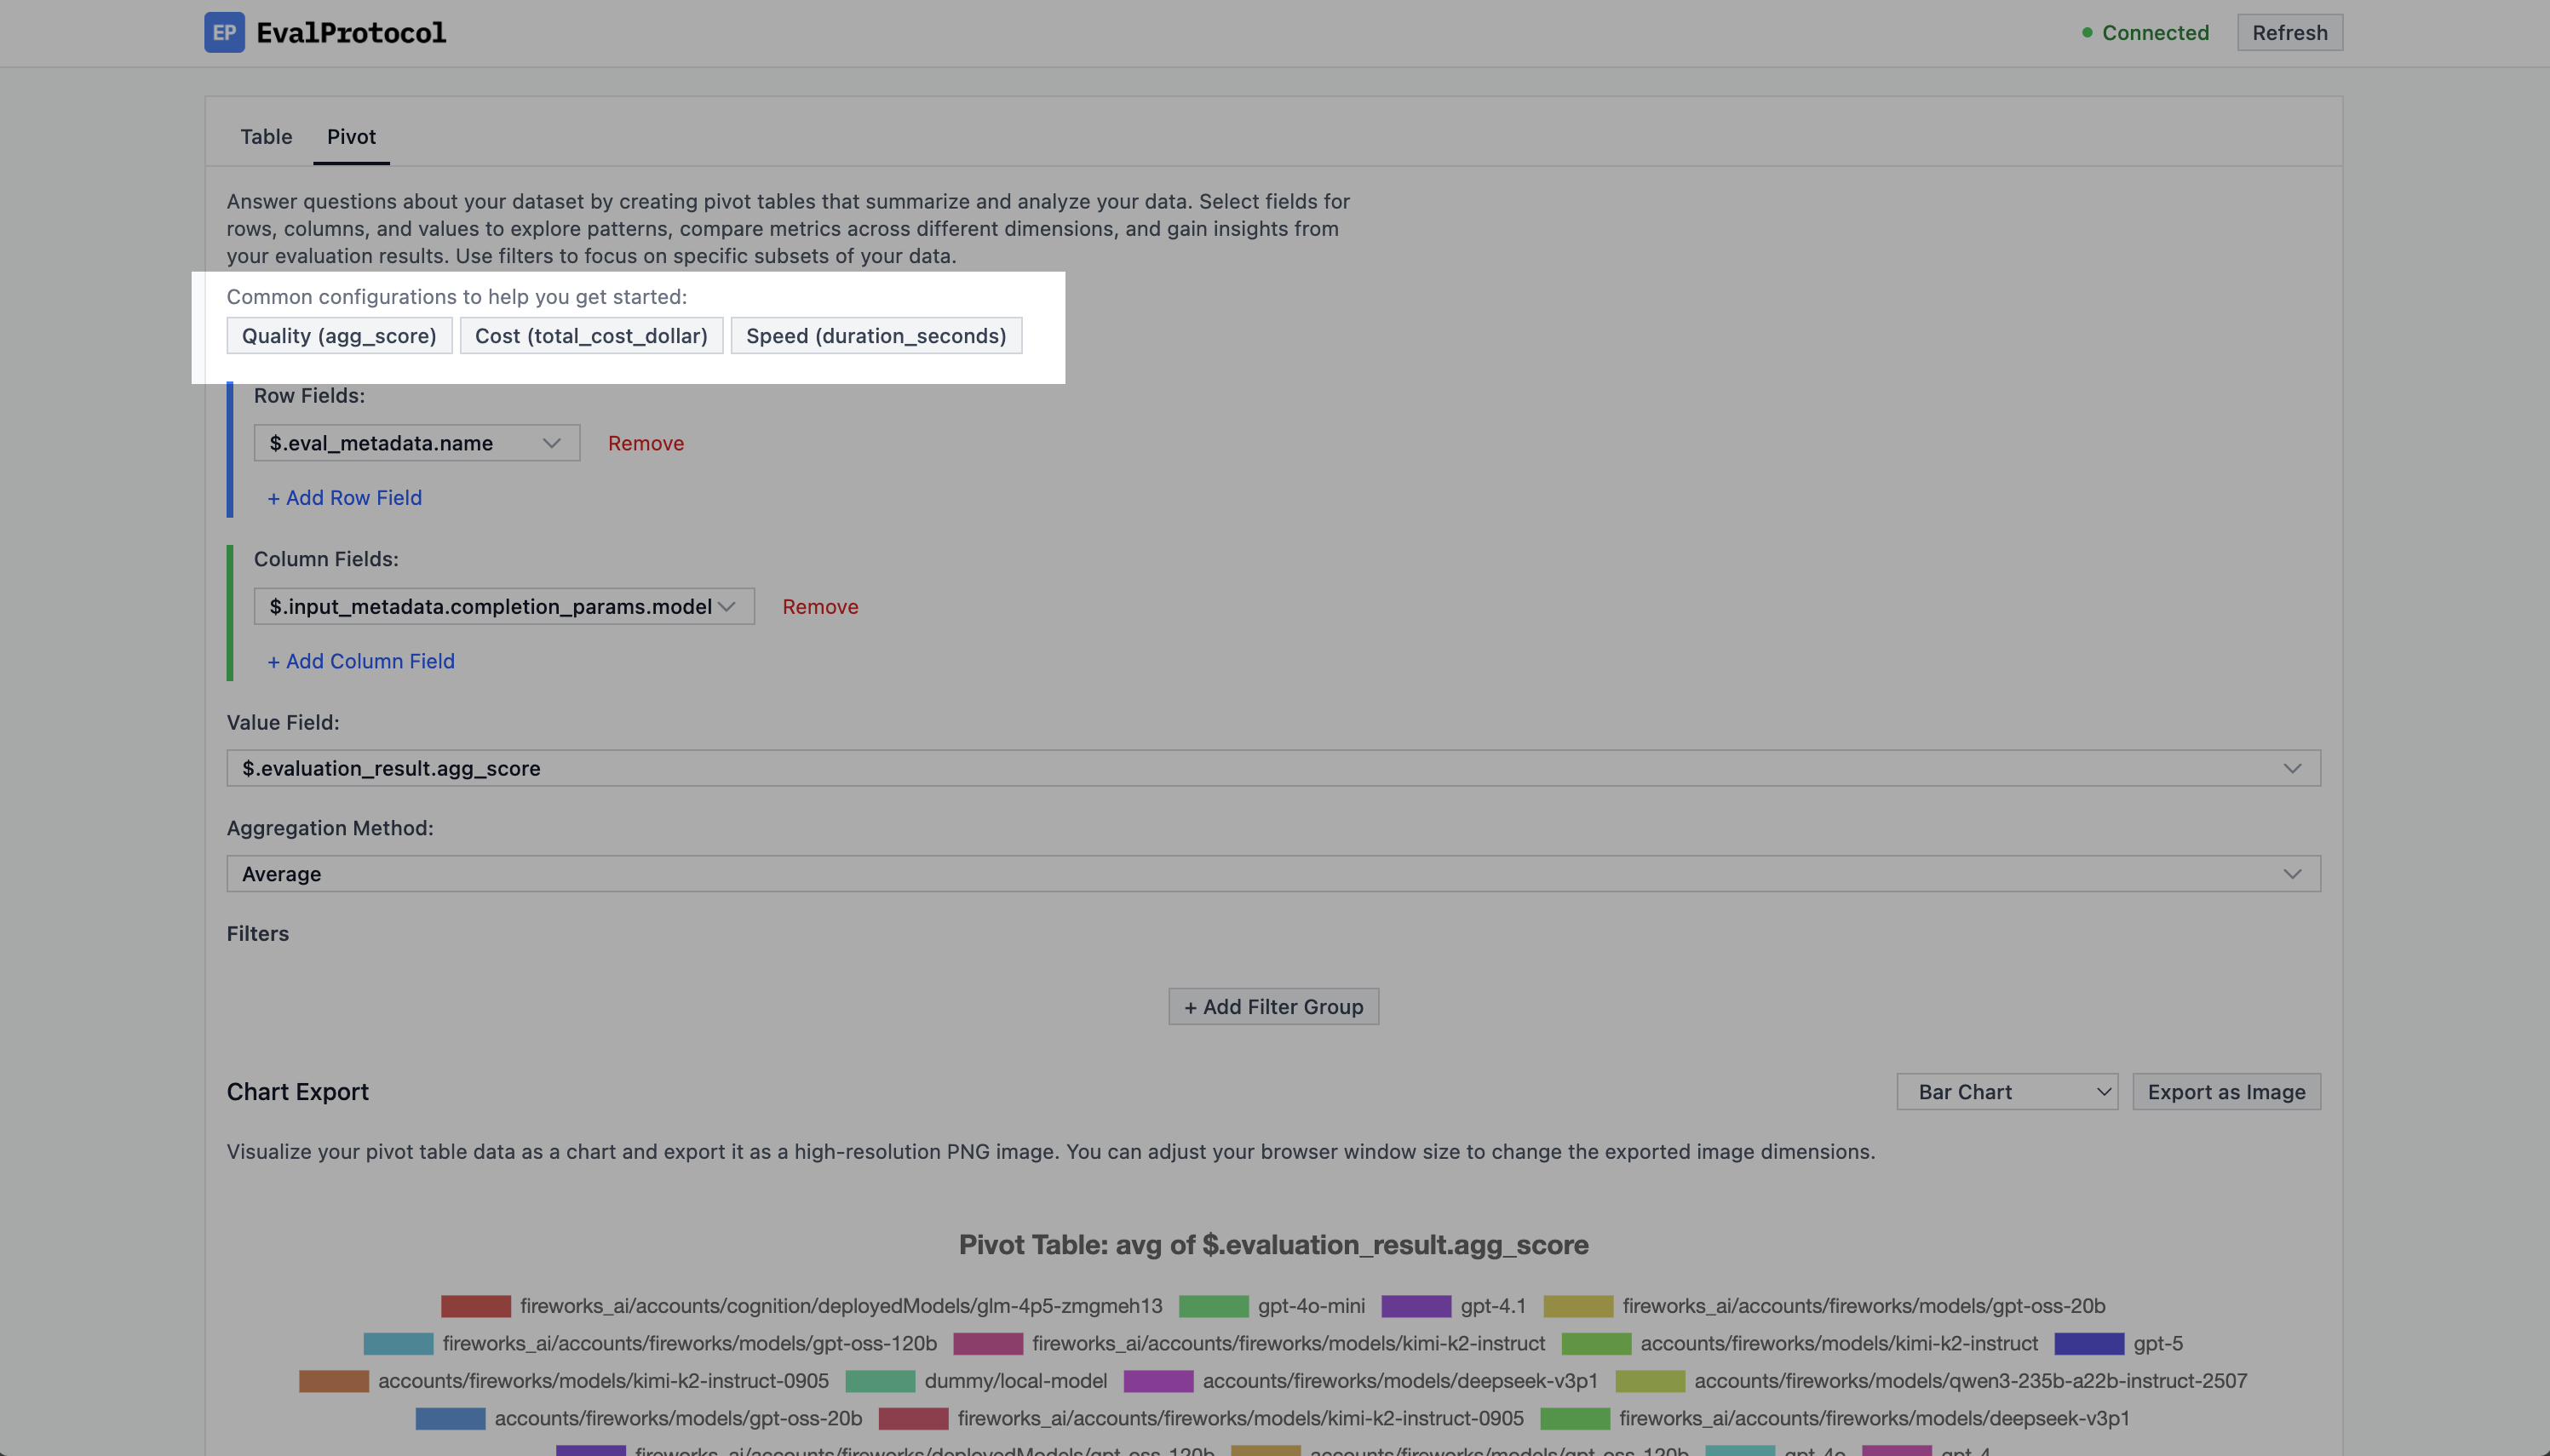
### Default configurations
There are three default configurations that you can easily select to help you
get started:
* `Quality (agg_score)`: This will show the average score of the data.
* `Cost (total_cost_dollar)`: This will show the total cost of the data.
* `Speed (duration_seconds)`: This will show the average duration of the data.
The buttons to select the default configurations to help you get started in the Pivot View.}>
The pivot table configuration section has five parts:
* **Pivot Rows**: The rows that will be used to group the data.
* **Pivot Columns**: The columns that will be used to group the data.
* **Pivot Values**: The values that will be used to aggregate the data.
* **Pivot Aggregation**: The aggregation function to use for the values.
* **Pivot Filters**: The filters that will be used to filter the data.
### Default configurations
There are three default configurations that you can easily select to help you
get started:
* `Quality (agg_score)`: This will show the average score of the data.
* `Cost (total_cost_dollar)`: This will show the total cost of the data.
* `Speed (duration_seconds)`: This will show the average duration of the data.
The buttons to select the default configurations to help you get started in the Pivot View.}>
 ### Viewing the data
Once you have configured the pivot table, you can view the data either by chart or table.
#### Chart
A chart will be automatically rendered based on the pivot table you generate.
Example of a chart rendered based on the pivot table.}>
### Viewing the data
Once you have configured the pivot table, you can view the data either by chart or table.
#### Chart
A chart will be automatically rendered based on the pivot table you generate.
Example of a chart rendered based on the pivot table.}>
 You can also click `Export as Image` to download the chart as an image.
#### Table
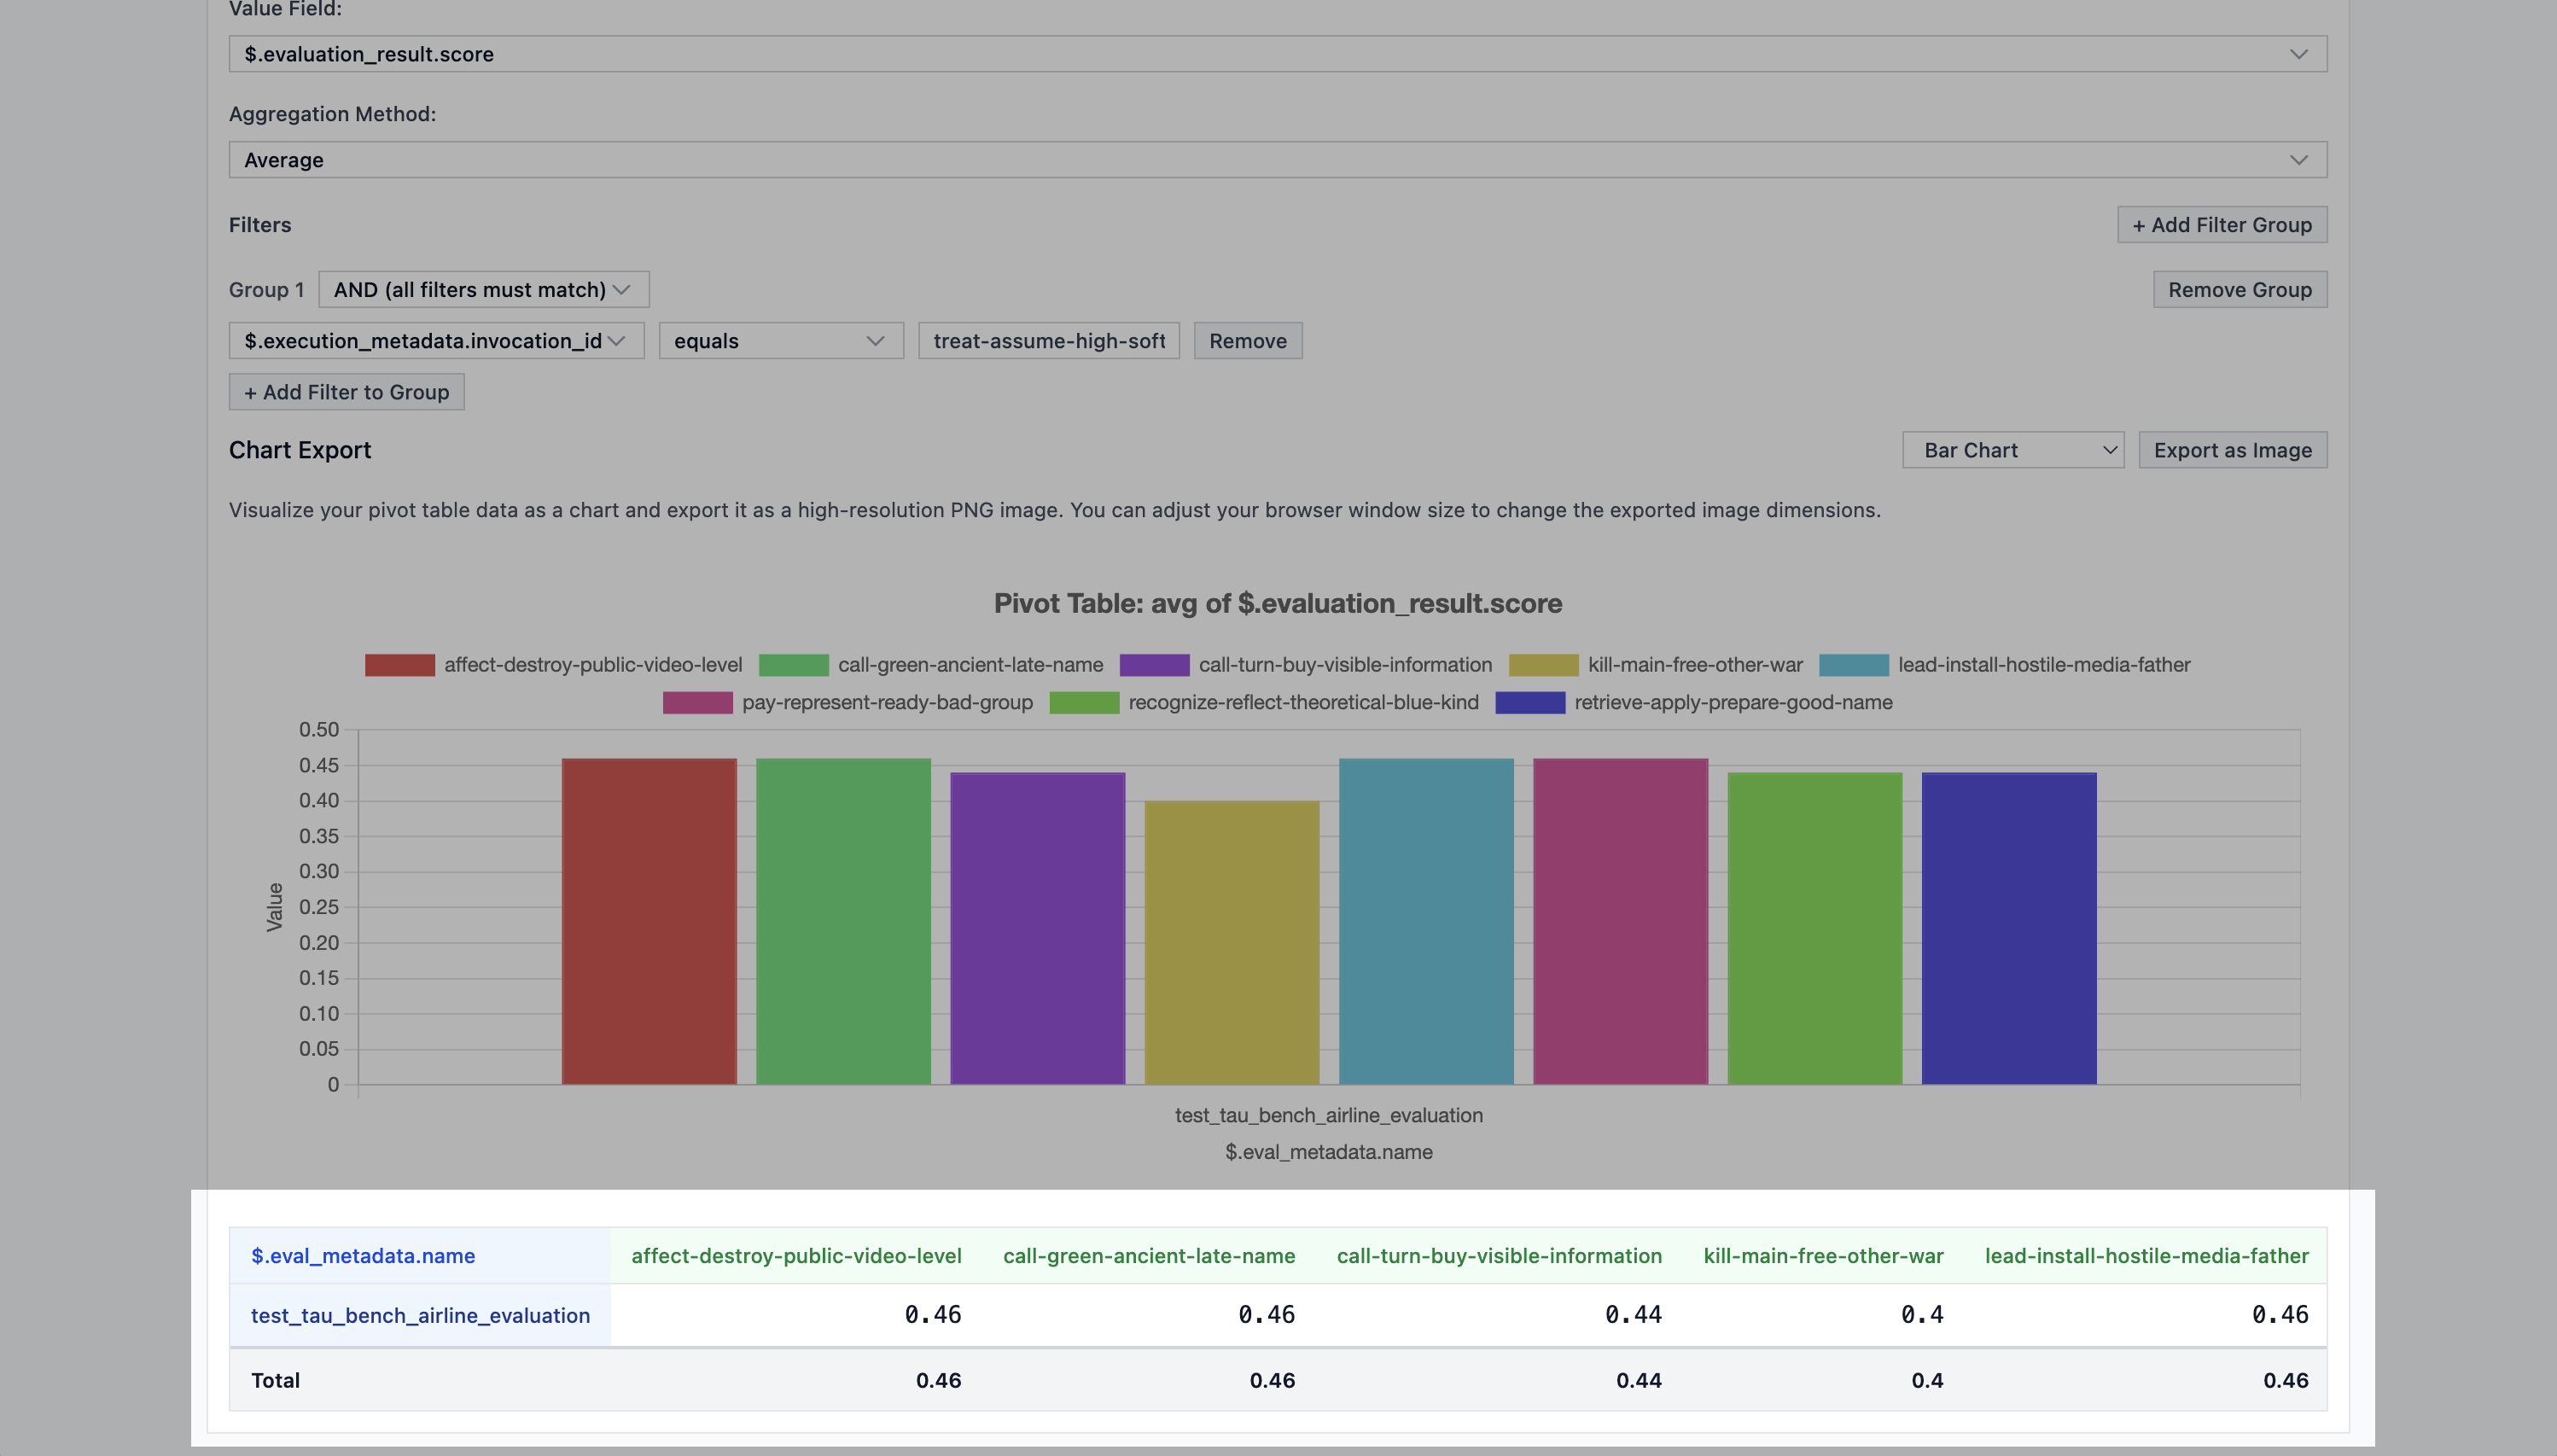
You can also see the exact computed values in the table view below the chart.
Example of the table view below the chart.}>
You can also click `Export as Image` to download the chart as an image.
#### Table
You can also see the exact computed values in the table view below the chart.
Example of the table view below the chart.}>
 You can also click `Export as CSV` to download the table as a CSV file.
### Example (Picking the best model for math problems)
An common example of how to use the pivot view to analyze the data is to compare the performance of different models on a given dataset. For our example, we will compare the performance of
1. gpt-oss-120b (on Fireworks)
2. kimi-k2-instruct (on Fireworks)
3. gpt-4o (on OpenAI)
4. gpt-4o-mini (on OpenAI)
An implementation of this eval is publicly available in EP at
[test\_aime25.py](https://github.com/eval-protocol/python-sdk/blob/main/eval_protocol/benchmarks/test_aime25.py).
To run this eval with 4 different models, you can modify the `completion_params`
parameter in the `evaluation_test` decorator to the following value:
```python focus={7-23} expandable theme={null}
@evaluation_test(
input_dataset=[
"https://huggingface.co/datasets/opencompass/AIME2025/raw/main/aime2025-I.jsonl",
"https://huggingface.co/datasets/opencompass/AIME2025/raw/main/aime2025-II.jsonl",
],
dataset_adapter=aime2025_dataset_adapter,
completion_params=[
{
"extra_body": {"reasoning_effort": "low"},
"model": "fireworks_ai/accounts/fireworks/models/gpt-oss-120b",
},
{
"extra_body": {"reasoning_effort": "low"},
"model": "fireworks_ai/accounts/fireworks/models/kimi-k2-instruct",
},
{
"model": "openai/gpt-4o",
},
{
"model": "openai/gpt-4o-mini",
},
],
rollout_processor=SingleTurnRolloutProcessor(),
aggregation_method="mean",
passed_threshold=None,
num_runs=8,
max_dataset_rows=2,
max_concurrent_rollouts=4,
mode="pointwise",
)
def test_aime25_pointwise(row: EvaluationRow) -> EvaluationRow:
assistant_msgs = [m for m in row.messages if m.role == "assistant"]
content = assistant_msgs[-1].content if assistant_msgs else ""
extracted_text = _extract_boxed_text(content or "")
extracted_int = _normalize_to_int_or_none(extracted_text)
gt_int = _normalize_to_int_or_none(row.ground_truth or "")
is_valid = extracted_int is not None and gt_int is not None
score = 1.0 if (is_valid and extracted_int == gt_int) else 0.0
metrics = {
"exact_match": MetricResult(
score=score,
is_score_valid=is_valid,
reason=(
"Parsed both integers and they matched"
if score == 1.0
else ("Parsed integers did not match" if is_valid else "Failed to parse integer")
),
data={
"extracted_text": extracted_text,
"extracted_int": extracted_int,
"ground_truth_int": gt_int,
},
)
}
row.evaluation_result = EvaluateResult(
score=score,
reason=("Answer correct" if score == 1.0 else "Answer incorrect"),
is_score_valid=is_valid,
metrics=metrics,
)
return row
```
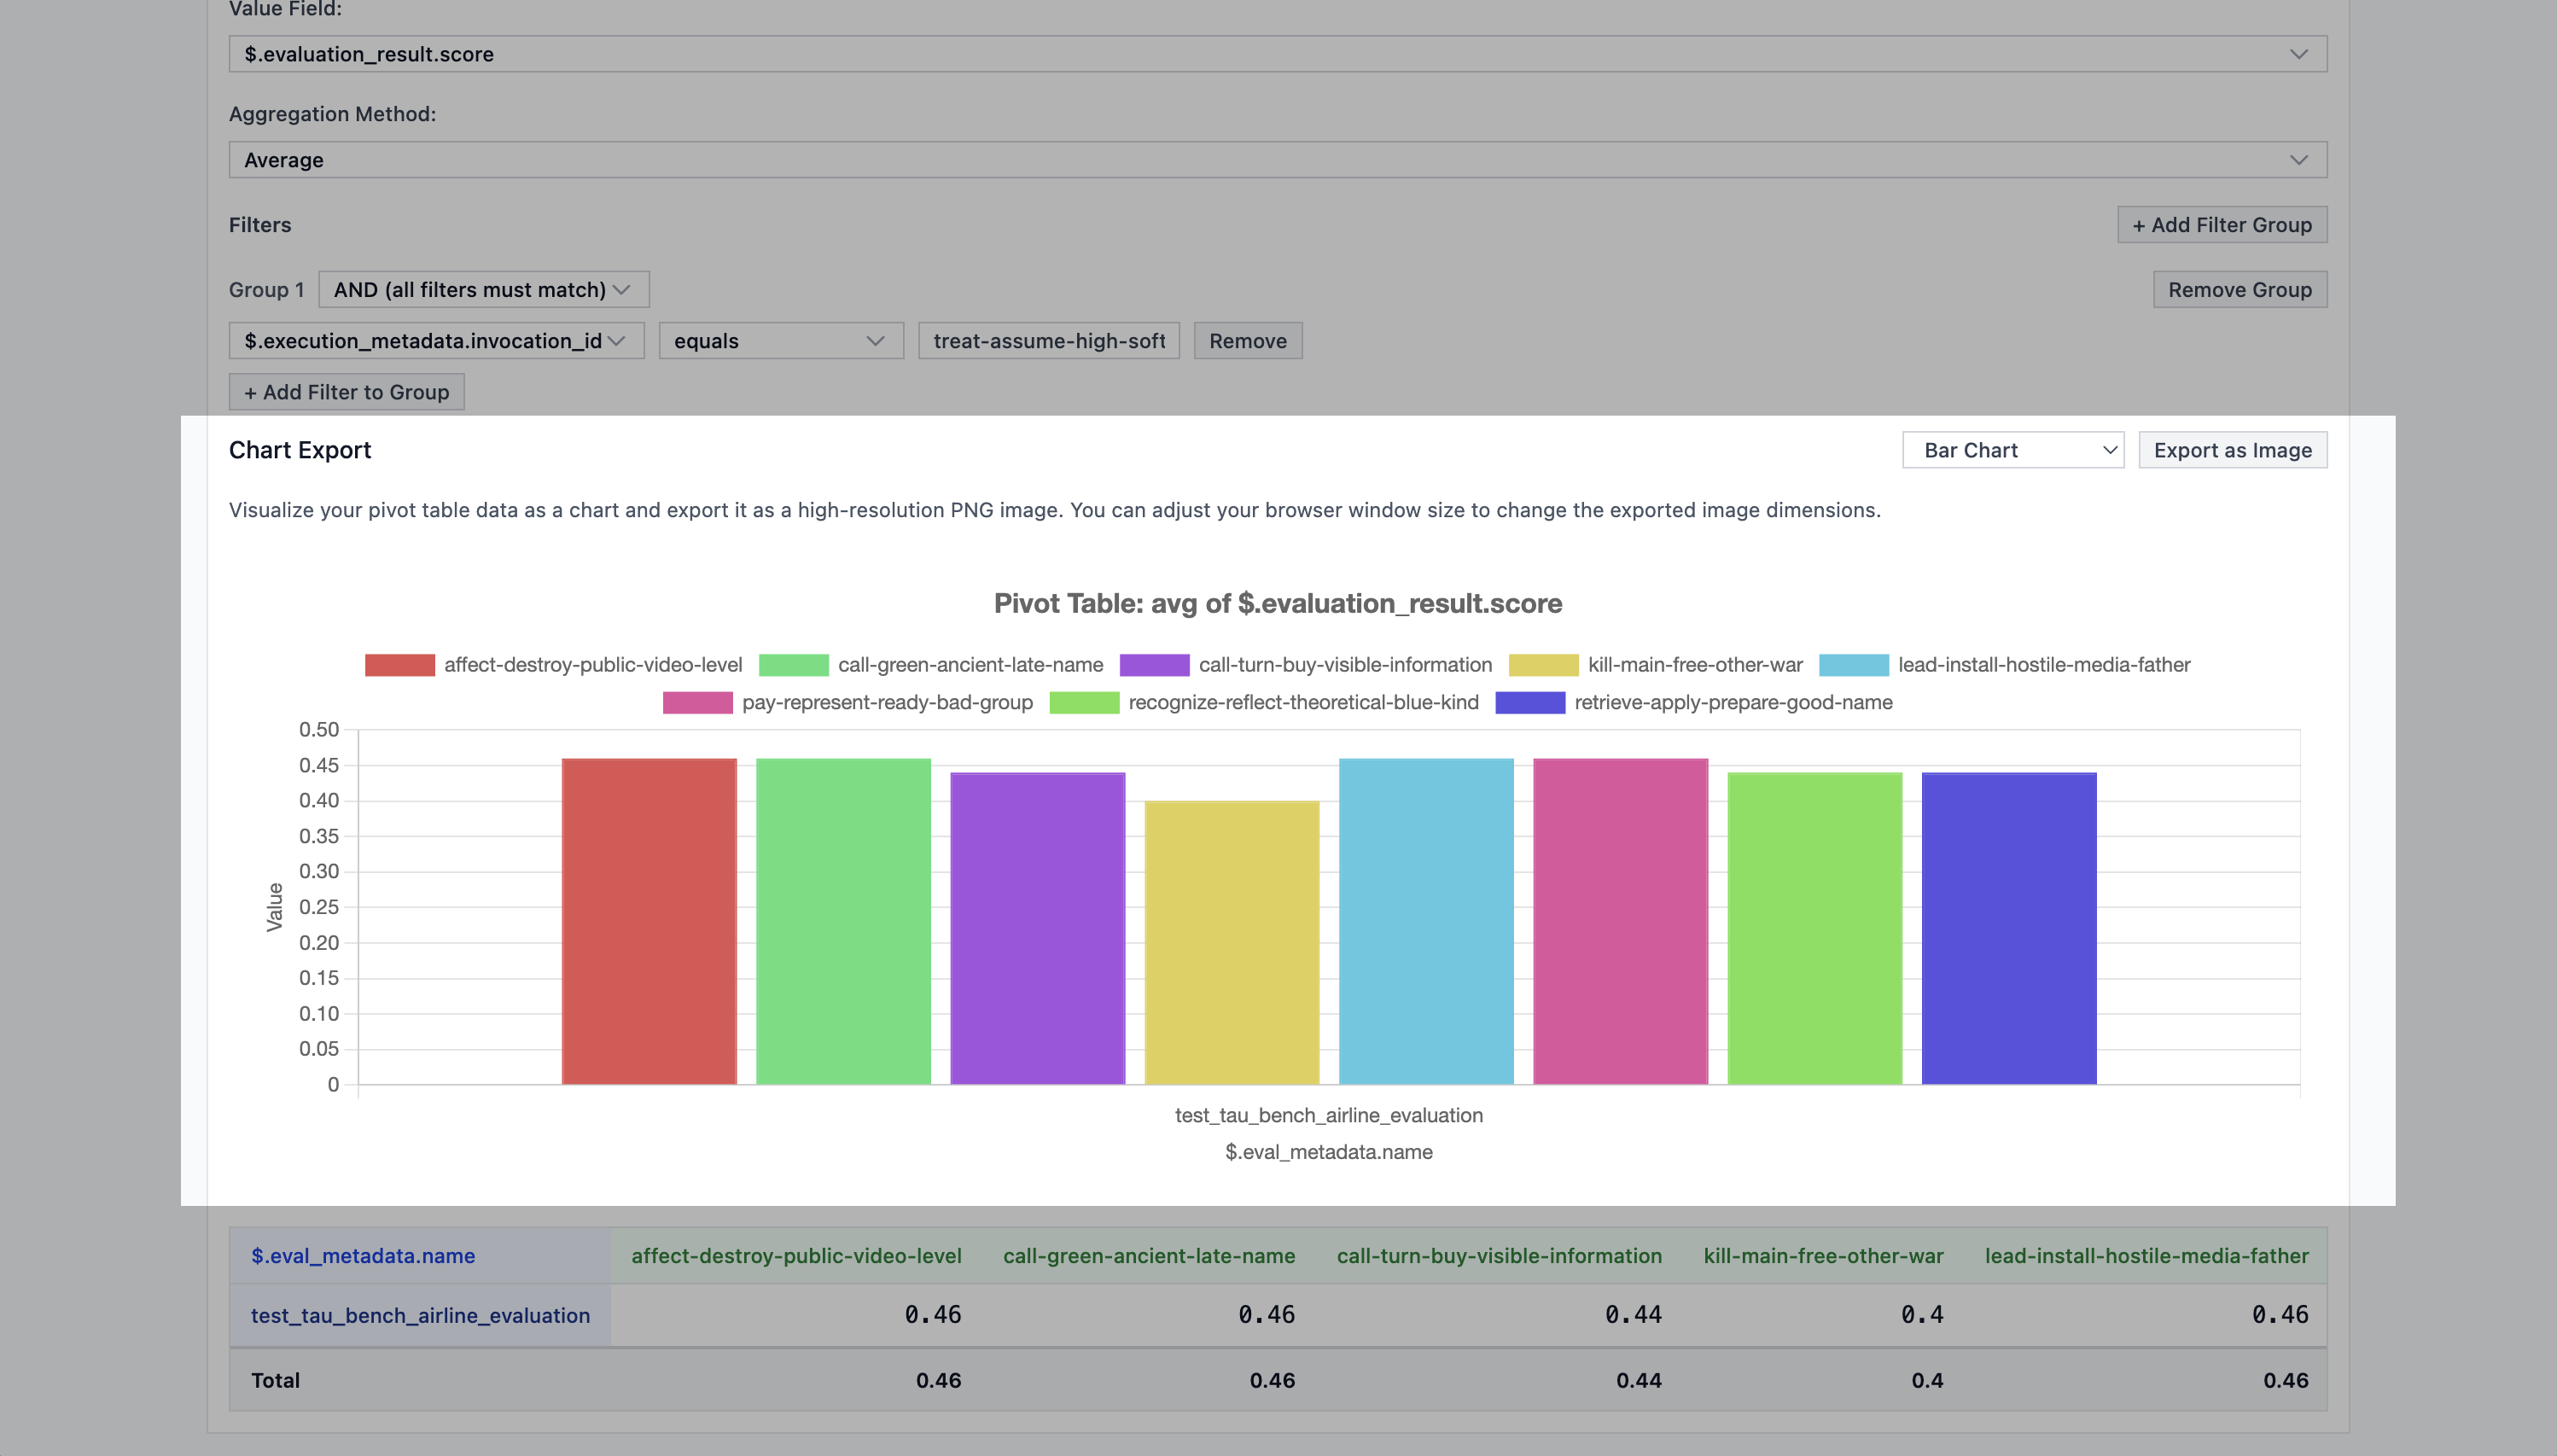
Then looking at the pivot view, after filtering for the `invocation_id` of the
execution, you can see the following chart using the default pivot view
configuration.
Example of the pivot view after running the AIME 2025 eval.}>
You can also click `Export as CSV` to download the table as a CSV file.
### Example (Picking the best model for math problems)
An common example of how to use the pivot view to analyze the data is to compare the performance of different models on a given dataset. For our example, we will compare the performance of
1. gpt-oss-120b (on Fireworks)
2. kimi-k2-instruct (on Fireworks)
3. gpt-4o (on OpenAI)
4. gpt-4o-mini (on OpenAI)
An implementation of this eval is publicly available in EP at
[test\_aime25.py](https://github.com/eval-protocol/python-sdk/blob/main/eval_protocol/benchmarks/test_aime25.py).
To run this eval with 4 different models, you can modify the `completion_params`
parameter in the `evaluation_test` decorator to the following value:
```python focus={7-23} expandable theme={null}
@evaluation_test(
input_dataset=[
"https://huggingface.co/datasets/opencompass/AIME2025/raw/main/aime2025-I.jsonl",
"https://huggingface.co/datasets/opencompass/AIME2025/raw/main/aime2025-II.jsonl",
],
dataset_adapter=aime2025_dataset_adapter,
completion_params=[
{
"extra_body": {"reasoning_effort": "low"},
"model": "fireworks_ai/accounts/fireworks/models/gpt-oss-120b",
},
{
"extra_body": {"reasoning_effort": "low"},
"model": "fireworks_ai/accounts/fireworks/models/kimi-k2-instruct",
},
{
"model": "openai/gpt-4o",
},
{
"model": "openai/gpt-4o-mini",
},
],
rollout_processor=SingleTurnRolloutProcessor(),
aggregation_method="mean",
passed_threshold=None,
num_runs=8,
max_dataset_rows=2,
max_concurrent_rollouts=4,
mode="pointwise",
)
def test_aime25_pointwise(row: EvaluationRow) -> EvaluationRow:
assistant_msgs = [m for m in row.messages if m.role == "assistant"]
content = assistant_msgs[-1].content if assistant_msgs else ""
extracted_text = _extract_boxed_text(content or "")
extracted_int = _normalize_to_int_or_none(extracted_text)
gt_int = _normalize_to_int_or_none(row.ground_truth or "")
is_valid = extracted_int is not None and gt_int is not None
score = 1.0 if (is_valid and extracted_int == gt_int) else 0.0
metrics = {
"exact_match": MetricResult(
score=score,
is_score_valid=is_valid,
reason=(
"Parsed both integers and they matched"
if score == 1.0
else ("Parsed integers did not match" if is_valid else "Failed to parse integer")
),
data={
"extracted_text": extracted_text,
"extracted_int": extracted_int,
"ground_truth_int": gt_int,
},
)
}
row.evaluation_result = EvaluateResult(
score=score,
reason=("Answer correct" if score == 1.0 else "Answer incorrect"),
is_score_valid=is_valid,
metrics=metrics,
)
return row
```
Then looking at the pivot view, after filtering for the `invocation_id` of the
execution, you can see the following chart using the default pivot view
configuration.
Example of the pivot view after running the AIME 2025 eval.}>
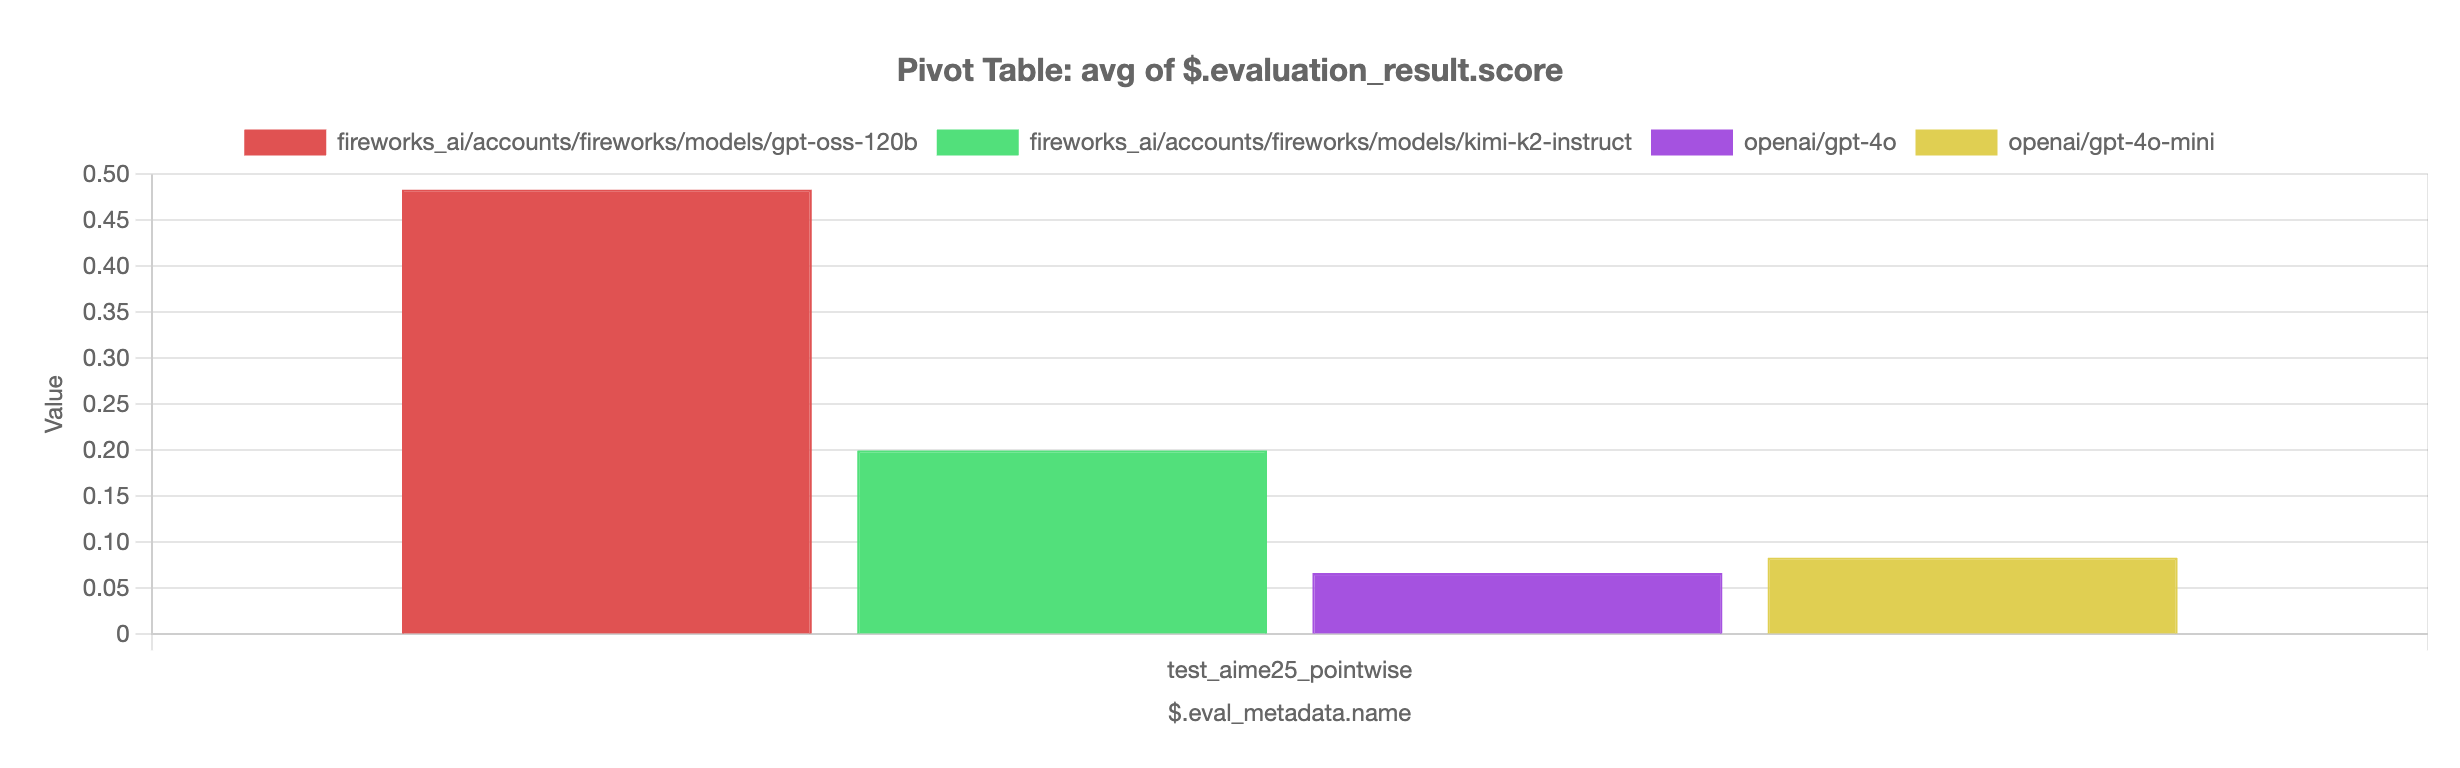 We can see that `gpt-oss-120b` out-performs the rest of the models using `"reasoning_effort": "low"`.